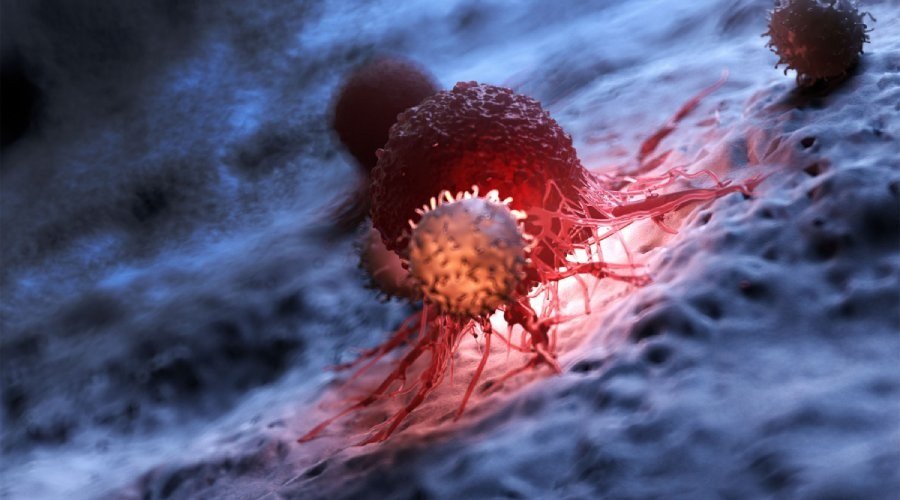
Oncology Live-cell microscopy has become an indispensable tool for improving our understanding of cancer pathogenesis
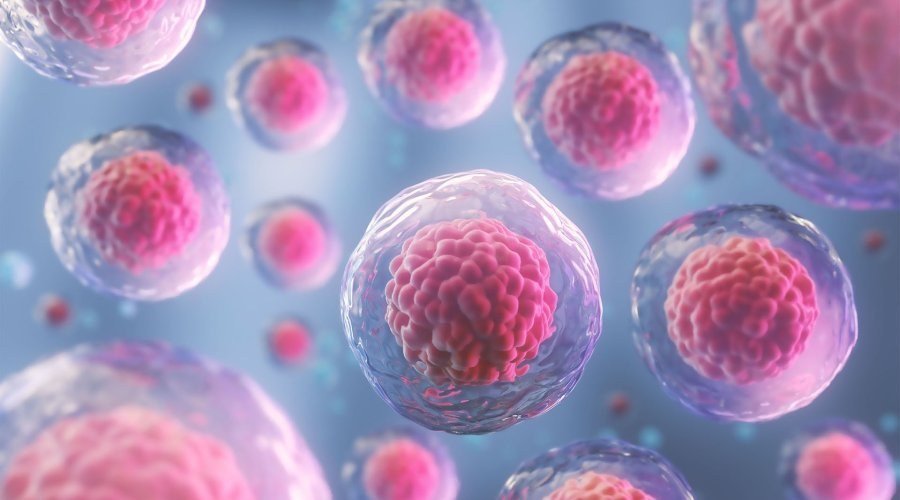
Immunology Time-lapse imaging of cell cultures is a powerful approach that can shed light on fundamental aspects of immune cell behavior