Introduction
Spheroids are three-dimensional cell aggregates with extensive cell-cell adhesions, thereby modeling the cellular interactions in a tissue [1, 2]. For a wide variety of tissues, spheroids have been produced: e.g. cardiomyocyte spheroids to model heart tissue [3], hepatocyte spheroids for liver tissue [4], and renal tubuloids representing kidney tissue [5]. These model systems can consist of one or multiple cell types that are naturally present in the tissue, and exhibit tissue-specific characteristics and functions [1]. Compared to traditional two-dimensional model systems, the three-dimensional structure of spheroids provides a more physiologically relevant cell morphology, cell polarity, cell-cell interaction, drug response, and gene and protein expression [2]. Spheroid cultures pose challenges compared to two-dimensional cultures. Large heterogeneities in spheroid properties are observed, originating from intra- and inter-operator variability in protocol execution, as well as differences in cell properties between batches and within samples [2, 6]. The heterogeneities, in combination with the labor-intensity of some of the currently applied methods for spheroid production [2, 6], impede the broad application of spheroids in high-throughput experiments [7].
The impact of these challenges could be largely reduced when using automated systems for spheroid culturing: the performance consistency of automated laboratory systems is much higher compared to manual tasks, while productivity and throughput can easily be increased [8, 9]. Such an automated system should also include components for sample monitoring and analysis. In this way, spheroid properties for experiments can easily be optimized, and possibly even the most suitable individual spheroids can be selected [10].
Therefore, this research aimed to create a proof-of-principle pipeline for automated imaging and analysis of spheroid cultures. For this purpose, HepG2 hepatoma cells were cultured to spheroids on various hydrogels, and meanwhile monitored using the CytoSMART® Lux2 and Lux3 BR. The KNIME® Analytics Platform 4.5 was used to train a model that recognizes and characterizes spheroids, enabling a laboratory system to automatically take appropriate action required for the experiment: e.g. start exposure to test- and control compounds, medium change, or spheroid sub-culturing.
Materials and methods
Human hepatoma HepG2 cells– supplemented with 10% fetal bovine serum (Gibco) and 1% penicillin-streptomycin (Gibco) – were seeded on top of hydrogels in µ-Slide Angiogenesis plates (ibidi) at 2000 cells/well, and cultured in an incubator providing standard culture conditions (37°C, 5% CO2). Cultures were monitored for 140 h, throughout which plates were placed on a CytoSMART® Lux2 or Lux3 BR for imaging. Whether the resulting images contained spheroids or not was manually annotated by two independent researchers.
The spheroid detection model was based on the pre-trained ResNet-50 model [11], a deep learning neural network model in vPython™ with 50 layers. The last one-third of the layers was retrained using 3524 of our images: 2584 images without spheroids and 940 images with spheroids (Fig. 1). The spheroid detection model was trained to identify the presence of spheroids in an image (1 = yes, 0 = no). A schematic representation of the pipeline for the automated spheroid imaging and analysis is depicted in Figure 2A. The images were resized to 224 x 224 pixels (field of view: 1.45 x 1.45 mm) and multiplicated to RGB channels, in order to meet the input requirements for the ResNet-50 model. Training was performed in the KNIME® Analytics Platform 4.5 (Fig. 2B). The Keras Image Data Generator [12] was applied for data augmentation to add noise and avoid overfitting. The data was split into a training (70%) and validation set (30%), where the model fitting was automatically stopped as soon as the performance on the validation set was no longer improving. Class weights were used to compensate for the imbalanced data set (spheroids : nonspheroids = 1:3). Model fitting was optimized using Adam [13] with a Binary_Crossentropy loss function [14] and Accuracy as the performance metric [15]. 553 images from one experiment were used as a hold-out data set for model evaluation (Fig. 2C). The spheroid identification performance was assessed by comparing the model prediction to the manual annotations.
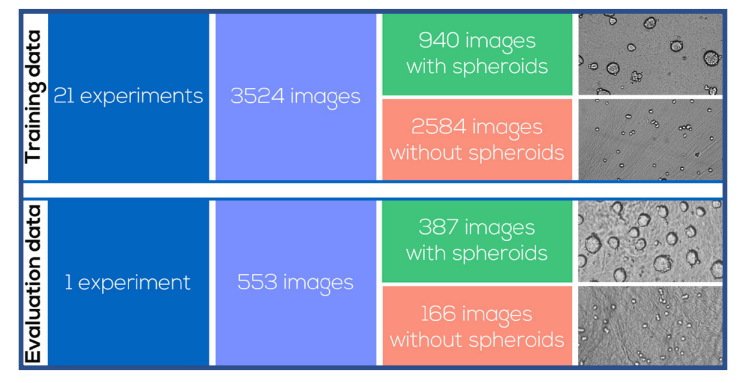
Fig. 1. Survey of spheroid images for model training and evaluation, including example images
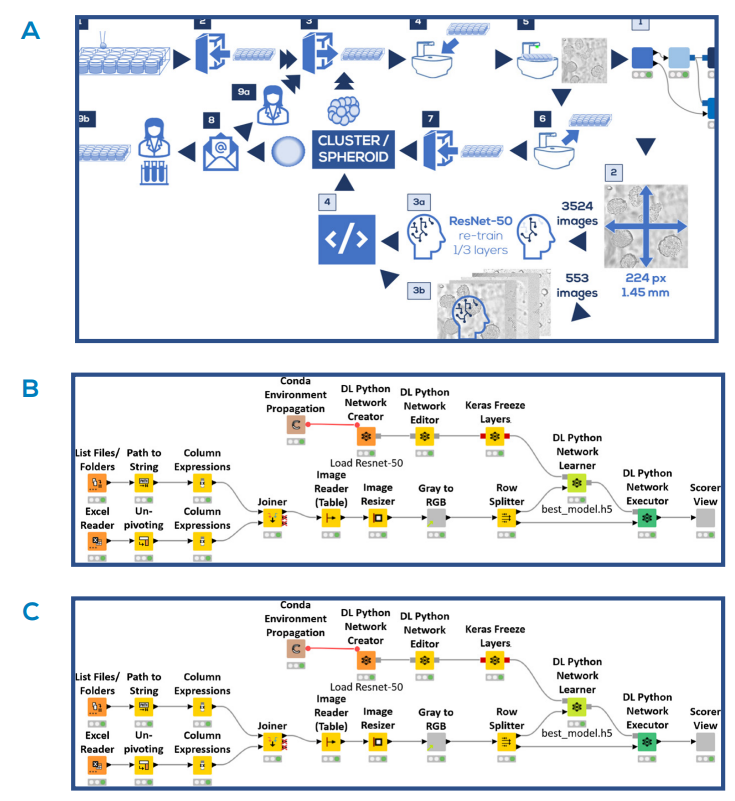
Fig. 2. Automated spheroid imaging and analysis pipeline. A) Schematic representation of the pipeline. Cell culture and imaging steps (dark boxes): Cells were seeded (1) and placed in the incubator (2). At predefined moments, the plates were taken from the incubator (3), placed on the CytoSMART® Lux2 or Lux3 BR (4) and an image was taken (5). The plate was taken off the device (6) and placed back into the incubator (7). In the meantime, the image processing and analysis steps were executed (light boxes): The image was loaded into KNIME® Analytics Platform 4.5 (1), and resized in order to meet the ResNet-50 input requirements (2). 3524 images were used to re-train ⅓ of the ResNet-50 layers (3a). The remaining 553 images were analyzed with the retrained model (3b), and classified as ‘cell cluster’ or ‘spheroid’ based on the model threshold (4). If no spheroids were detected, the experimental procedure (dark boxes) would continue at step (3). If spheroids were detected, an analysis report was sent by email (8), after which the user could decide to either continue the culturing process (9a), or use the spheroids in an experiment (9b). B) Overview of the model training workflow done in KNIME® Analytics Platform 4.5. C) Overview of the workflow to evaluate model predictions in KNIME® Analytics Platform 4.5.
Results
Representative images for the entire data set made with the CytoSMART® Lux2 and Lux3 BR are shown in Figure 3. These images were used to train and evaluate the spheroid detection model. The training accuracy of the model was found to be 0.976 and the validation accuracy was 0.965. Model performance on the 553 images in the data set for evaluation is depicted in Figure 4. For all 387 images that contained spheroids, the model correctly detected spheroid presence, providing a model sensitivity of 100%. With 477 images in total correctly classified, the overall model accuracy was 86.3%. In all 76 incorrectly classified images, the model predicted the presence of a spheroid where none was annotated. Consequently, the model specificity for spheroid detection was 54.2%.
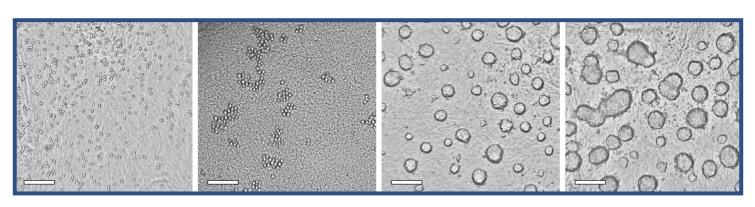
Fig. 3. Representative images for the training and evaluation data sets, made with the CytoSMART® Lux2 or Lux3 BR. Images with spheroids as well as images without spheroids are shown. Scale bar = 250 µm
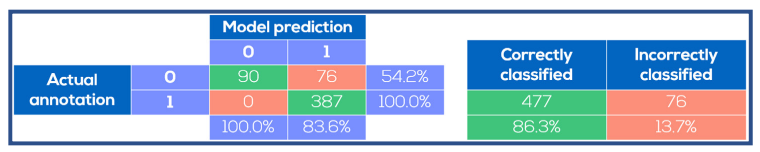
Fig. 4. Spheroid identification performance on test images. The model prediction was compared to the manual annotations. The model was always correct when it predicted absence of spheroids, whereas spheroids were predicted to be present in certain images where no spheroids were annotated.
Discussion
The three-dimensional cell environment in spheroid cultures is physiologically more relevant compared to conventional two dimensional culture systems. However, spheroid cultures are subject to large variations originating from manual protocol execution and cell properties. These variations can be minimized using automated culture systems, and therefore this research provided a proof-of-principle pipeline for automated spheroid culture imaging and analysis. Spheroids consisting of HepG2 hepatoma cells were monitored using the CytoSMART® Lux2 and Lux3 BR. The KNIME® Analytics Platform 4.5 was used to train a deep learning model based on the ResNet-50 model to recognize and characterize spheroids. The resulting model was correct in every instance in the evaluation data where human observers annotated the presence of spheroids, as well as all images where the model predicted spheroids to be absent. The only incorrectly classified set of images consisted of images manually annotated with just single cells and cell clusters, whereas the model predicted the images to contain spheroids. For experimental read-outs involving spheroids, it is essential that the spheroid properties at the end of the preparation process are known, within a desired range, and as consistent as possible [16]. This consequently enables the fairest comparison between experimental groups. A possible strategy to achieve this is extensive culture protocol optimization, consequently assuming that the optimized (average) properties hold for the entire population in a reproducible manner [17, 18]. However, with intra- and inter-operator variability in protocol performance, as well as differences in cell properties between batches and within samples [2, 6], this assumption may cause experimental and practical challenges resulting from – preventable – spheroid variations. Therefore, it is highly beneficial to always monitor spheroid properties during production and experimental treatment – even after extensive protocol optimization [19]. In order to obtain more detailed insight in spheroid properties, brightfield monitoring has many advantages over fixation and histological examination [18] or fluorescent stainings [20], since the latter approaches are destructive or can alter spheroid properties [21].
In this proof-of-principle study, it was chosen to perform automated spheroid identification using a machine-learning approach, rather than an algorithm with pre-defined and fixed spheroid properties. This approach was chosen following the absence of a detailed definition for morphological spheroid properties: a size range is not defined [19, 22] and spheroid outline indications can be highly observer-dependent [16]. Besides that, surrounding individual cells may obscure the precise spheroid outline [23], further complicating the spheroid detection. The applied machine-learning strategy enabled spheroid detection and selection, while aiming at minimal subjectivity. The presented model proved to be very good in detecting spheroids, indicated by the sensitivity of 100%. However, the selectivity of 54.2% underlined the challenges caused by the absence of an indisputable definition of spheroids.
In the pipeline displayed in Figure 2C, the results of the spheroid detection model were sent to the SiLA Server. Since the CytoSMART® devices can also be controlled using SiLA, the entire system presented in this case study could be incorporated in a (pre-existing) SiLA-compatible workflow. Here, the benefits of standards for automated laboratory systems are highlighted. Nevertheless, the KNIME®- and CytoSMART® systems are not restricted to SiLA-compatible workflows: the flexibility of the systems enables incorporation via other approaches as well. The confluence quantifications over time indicated competition between the HeLa cells and the 3T3 cells. However, which of the cell types was eliminated was dependent on the initial ratio. In previous research, it was found that NAFs can prevent tumor growth [6]. We found this is only possible with a minimal initial percentage of fibroblasts. NAFs can suppress tumor growth via TNF-α excretion [6]. However, we observed that tumor-suppressing properties of NAFs became stronger with higher environmental TNF-α concentrations. The Omni FL enabled monitoring of this multi-factor experimental setup, thereby revealing the interaction between the seeding ratio and the TNF-α concentration in establishing the dominant cell type.
Conclusion
This research provided a proof-of-principle pipeline for automated spheroid culture imaging using the CytoSMART® Lux2 and Lux3 BR, and analysis using the KNIME® Analytics Platform 4.5 recognizing and characterizing spheroids. The resulting model detected the presence of spheroids if a human observer did, although ambiguities in the definition of spheroids caused some disagreement between the model and human observer in indicating the absence of spheroids. Although the pipeline was now presented as a standalone solution, it can easily be integrated in automated workflows.
References
[1] Fennema, E. et al. (2013). Spheroid culture as a tool for creating 3D complex tissues. Trends in biotechnology, 31(2), 108-115.
[2] Chaicharoenaudomrung, N. et al. (2019). Three-dimensional cell culture systems as an in vitro platform for cancer and stem cell modeling. World journal of stem cells, 11(12), 1065.
[3] Beauchamp, P. et al. (2015). Development and characterization of a scaffold-free 3D spheroid model of induced pluripotent stem cell-derived human cardiomyocytes. Tissue Engineering Part C: Methods, 21(8), 852-861.
[4] Kyffin, J. A. et al. (2019). Characterisation of a functional rat hepatocyte spheroid model. Toxicology in Vitro, 55, 160-172.
[5] Yousef Yengej, F. A. et al. (2020). Kidney organoids and tubuloids. Cells, 9(6), 1326.
[6] Sant, S. & Johnston, P. A. (2017). The production of 3D tumor spheroids for cancer drug discovery. Drug Discovery Today: Technologies, 23, 27-36.
[7] Han, S. J. et al. (2021). Challenges of applying multicellular tumor spheroids in preclinical phase. Cancer Cell International, 21(152).
[8] Zimmermann, S. (2021). Laboratory Automation in the Microbiology Laboratory: an Ongoing Journey, Not a Tale?. Journal of Clinical Microbiology, 59(3), e02592-20.
[9] Automata (2021). 2021 Trends in Lab Automation. Retrieved from: https://automata.tech/2021-trends-in-lab-automation/?utm_medium=email&_ hsmi=127976597&_hsenc=p2ANqtz-9PdNcDUb7des0kfflt6yymh4IPRFdue7XasnAmDZgkIK4-oseJji2tFBzhqo0rpXrNbHTjqWDZkU89fwXwt1TIfq-ER8ElMoRgavQB0zhtnXu-7k&utm_content=127976597&utm_source=hs_automation.
[10] Zanoni, M. et al. (2016). 3D tumor spheroid models for in vitro therapeutic screening: a systematic approach to enhance the biological relevance of data obtained. Scientific reports, 6(19103).
[11] He, K. et al. (2015). Deep residual learning for image recognition. In: Proceedings of the IEEE conference on computer vision and pattern recognition (pp. 770-778).
[12] Keras (n.d.). tf.keras.preprocessing.image.ImageDataGenerator. Retrieved from: https://www.tensorflow.org/api_docs/python/tf/keras/ preprocessing/image/ImageDataGenerator.
[13] Kingma, D. P. & Ba, J. (2014). Adam: A method for stochastic optimization. arXiv preprint, DOI: 10.48550/arXiv.1412.6980.
[14] Keras (n.d.). Losses. Retrieved from: https://keras.io/api/losses/.
[15] Keras (n.d.). Metrics. Retrieved from: https://keras.io/api/metrics/.
[16] Shirai, K. et al. (2020). The importance of scoring recognition fitness in spheroid morphological analysis for robust label-free quality evaluation. Regenerative therapy, 14, 205-214.
[17] Alexander, F. et al. (2018). A novel lab-on-a-chip platform for spheroid metabolism monitoring. Cytotechnology, 70, 375-386.
[18] Redondo-Castro, E. et al. (2018). Changes in the secretome of tri-dimensional spheroid-cultured human mesenchymal stem cells in vitro by interleukin-1 priming. Stem cell research & therapy, 9(11).
[19] Friedrich, J. et al. (2009). Spheroid-based drug screen: considerations and practical approach. Nature protocols, 4(3), 309-324.
[20] Sirenko, O. et al. (2015). High-content assays for characterizing the viability and morphology of 3D cancer spheroid cultures. Assay and drug development technologies, 13(7), 402-414.
[21] Cheng, R. et al.(2019). Influence of fixation and permeabilization on the mass density of single cells: a surface plasmon resonance imaging study. Frontiers in Chemistry, 7(588).
[22] Huang, B. W. & Gao, J. Q. (2018). Application of 3D cultured multicellular spheroid tumor models in tumor-targeted drug delivery system research. Journal of controlled release, 270, 246-259.
[23] Keller, F. et al. (2019). Towards optimized breast cancer 3D spheroid mono-and co-culture models for pharmacological research and screening. Journal of Cellular Biotechnology, 5(2), 89-101.