Movement of cells plays a critical role in the development of cancer. Analyzing the motility of cells in vitro is therefor important for many cancer researchers.
Live-cell imaging, and in particular label-free live-cell imaging, is well suited to capture dynamic processes in cell culture without potential side-effects of markers or dyes on the cells. In the text below we will discuss the suitability of the CytoSMART Lux for several assays relevant for cancer research.
We will discuss
- Introduction to the Lux cell monitoring system
- Tube formation assays
- 2D migration assays
- 3D invasion assays
The CytoSMARTTM lux cell monitoring system
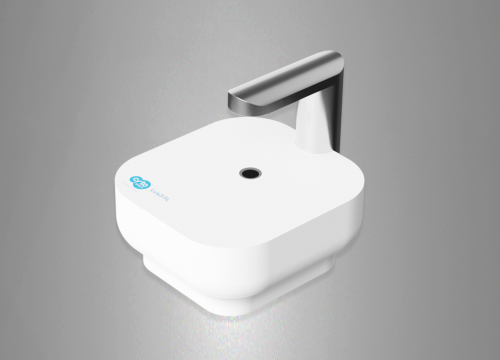
The CytoSMARTTM lux is an easy-to-use live cell monitoring system. The compact design makes the Lux ideal for placing inside a standard cell culture incubator. It has been designed for applications, which require a larger field-of-view, such as cell culture documentation and migration assays. The field-of-view is 2.4*1.5 mm and the magnification is similar to that typically achieved with a 10X objective of a conventional microscope. The images generated by the Lux are uploaded to a secure cloud portal, that is only accessible by using the password set by the user.
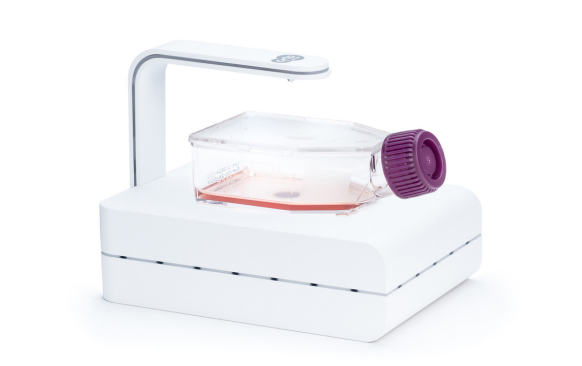
Figure 1 the compact (13.3 x 9.0 x 10.0 cm (L x W x H)) CytoSMART Lux is suitable for use inside any standard cell culture incubator.
Tube Formation Assays
The formation of new blood vessels is required to ensure sufficient nutrient and oxygen supply and to allow solid tumors to grow beyond a certain size. This process can be mimicked in cell-culture in so-called tube formation assays.
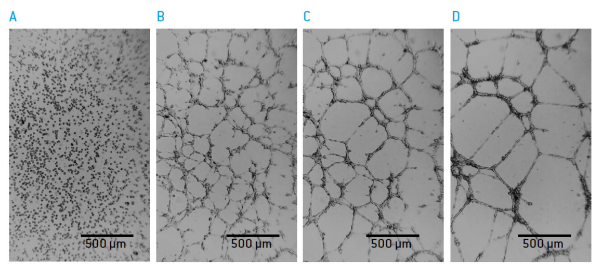
Figure 2: Tube formation of HUVEC cells on BME A) 0 hours B) 3 hours C) 6 hours D) 17 hours after seeding.
Human Umbillical Vein Endothelial Cells (HUVEC; Lonza P/N: C2519A) were seeded on 150 μl Basement Membrane Extract (BME; MatrigelTM Corning P/N 356237) in standard 48-well culture plates. The formation of endothelia tubes awas monitored live in selected wells.
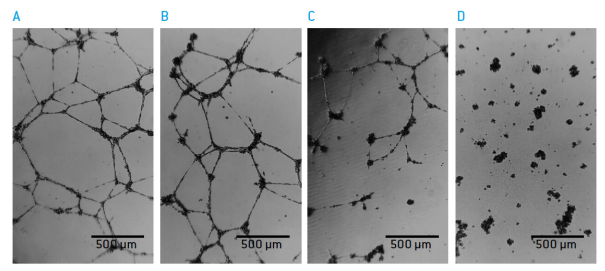
Figure 3: tube formation of HUVEC is inhibited by Surmin 18 hours after seeding A) 0 μM of Suramin B) 2.5 μM Suramin C) 7.5 μM Suramin and D) 10 μM Suramin.
Cell aggregation into tube-like structures started immediately after seeing of cells and defined tube-like structures became visible after 4-6 hours. Tubes were stable for up to 24 hours. Understanding the kinetics of tube formation by time-lapse imaging allowed finding the optimal time-points for quantitative analysis of the effect of Sumarin (Sigma P/N S2671) on tube formation.
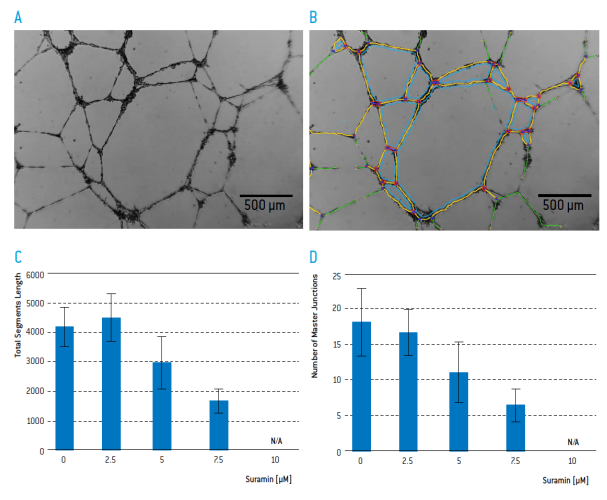
Figure 4 A) Tube formation of HUVEC on BME 18 hours after seeding B) Image Analysis with Angiogenesis Analyser Module of Image J. Tube segments are colored in yellow, green and blue and master junctions in pink. Impact of Suramin on C) total segment length and D) the number of master junctions. (n=6)
Suramin inhibited the formation of tubular structures. For quantitative analysis, images were captured 18 hours after seeding in 3 different positions of each well by using the CytoSMARTTM Lux like a standard cell culture microscope.
Using the Angiogenesis Analyser module of Image J (https://imagej.nih.gov/ij/) the number of master junctions and the total segment length per image were quantified. This was easily possible in all images made by the CytoSMARTTM Lux, with the exception of the images that were taken in the presence of 10 μM Suramin. In those cases no clear distinction between the actual tubular structures and debris could be made by the software.
2D Cell Migration Assay
The migration of cancer cells is required for growth and metastasis of tumors. A basic test to measure the migration potential of cells is to monitor the closure of a so-called wound or scratch in a confluent monolayer of cancer cells.
The human colorectal carcinoma cell line HCT 116 (ATCC, P/N CCL-247) was seeded into 35 mm microdishes containing a culture insert. (ibidi, P/N 81176). After reaching confluence and removal of the culture insert a defined scratch is formed. Closure of the gap was monitored with the CytoSMARTTM Lux.
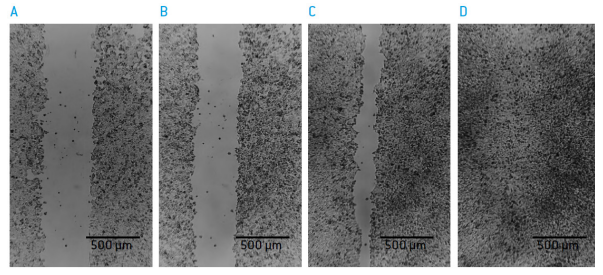
Figure 5: “wound closure” of HCT 116 cells A) 0 hours B) 15 hours C) 30 hours and D) 40 hours after “wound” creation.
Images were analysed with the ImageJ MRO Wound Healing Tool or with the scratch assay measurement of the CytoSMART cloud portal for the Lux system. In order to monitor the effect of DL-Sulforaphane (Sigma, P/N S4441) on gap closure.
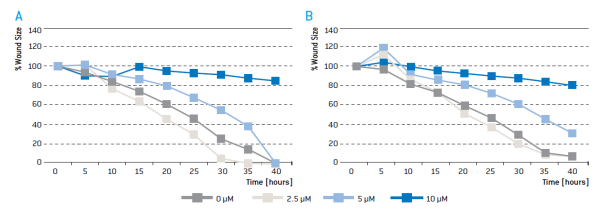
Figure 6: kinetics of wound closure of HCT 116 cells exposed to different concentrations of Sulforaphane with the A) ImageJ MRI Wound Healing Tool or the B) scratch assay measurement of the CytoSMART cloud portal algorithm.
Gap closure could be quantitatively analysed with both the ImageJ and CytoSMARTTM image analysis algorithms. In samples treated with no or low amounts of Sulforaphane, gap closure is observed after ~35 hours. In samples treated with 5 μM Sulforaphane cell closure is delayed. In the presence of 10 μM Sulforaphane almost no reduction of gap width was observed. The speed of gap closure varies among different cell types (data not shown). While some cell types close gaps within hours others take days to close a gap of similar size. Live cell imaging allows researchers to capture the kinetics of gap closure and to identify the optimal time point for quantitative image analysis.
3D Invasion Assay
Migration of cancer cells in vitro often requires the movement through extracellular matrix. This process can be mimicked by embedding cancer cells into a threedimensional (3D) matrix and monitoring their invasion into 3D matrix. The human, presumably glioblastoma cell line U-87 MG (ATCC, P/N HTB-14) was plated into round-well ultra-low attachment plates (Corning, P/N: 7007). After three days spheroids have formed and were overlaid with BME cell invasion matrix (trevigen, P/N 3500-096-K). Invasion of cells into the surrounding matrix was monitored with the CytoSMART Lux under constant temperature and CO2 levels, without agitating the cultures. The migration properties of individual cells could be observed in realtime.
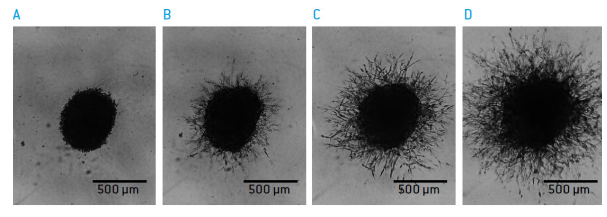
Figure 7: Sprouting of U-87 MG from a spheroid structure into a 3D matix A) day 0, B) day 1, C) day 2, D) day 3.
The effect of DL-Sulforaphane on U-87 MG sprouting was quantified using image J.
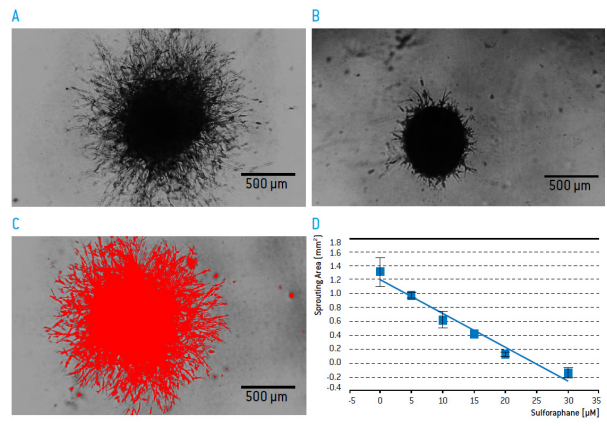
Figure 8: Sprouting of U-87-MG from a spheroid structure into a 3D matrix after 3 days of culture in the A) absence B) presence of 30 μM of Sulforaphane. C) Quantification of sprouting with Image J. D) Impact of Sulforaphane on sprouting (normalized to the size of spheroids on day 3 cultured in the absence of sulforaphane and invasion matrix, n=2)
Conclusions
The CytoSMARTTM Lux is an easy-to-use live cell monitoring systems, suitable for analysis of different cancer-relevant assays. Individual cells can be recognized in the resulting images. Therefore they can be quantified using software tools like Image J or the CytoSMARTTM cloud portal.