Authors: Dr. Inge van Loosdregt, Manuel Reitberger, and Joffry Maltha
1 CytoSMART Technologies, Eindhoven, The Netherlands,
2 German Cancer Research Center, Heidelberg, Germany
Introduction
Cell toxicity, viability, and growth are measures widely used in the fields of cancer research, drug development, and tissue engineering. These measures are commonly determined via colorimetric or luminescence based assays such as tetrazolium salt based assays (e.g. MTT [1]) or resazurin based assays (e.g. Alamar Blue [2]). These types of assays use metabolic activity as a measure for cell viability [3]. Metabolic active cells enzymatically reduce a compound of a certain color into a (fluorescent) compound of a different color [3]. The magnitude of the absorbance or fluorescence of the converted compound can thus be used as a measure for cell viability.
Even though these assays are relatively cheap, quick, and easy to use [1], [2], they have several downsides that can be difficult to overcome. One of the major downsides is that these assays can only be used as end-point measurements since the compounds are generally toxic [3]. Even though resazurin was found not to be toxic to lymphocytes [2], the reduced form of resazurin (resorufin) can bleach at prolonged incubation times [4] and can be quenched by 10% FBS [4], [5], making it unsuitable for long-term real-time monitoring.
Another limitation of measuring metabolic activity is that the enzymatic conversion rate of the compound is dependent on factors such as the conditions in which the cells are cultured, the intrinsic metabolic activity level of the tested cell type and cell cycle phase (e.g actively dividing or quiescent cells) [4], [5]. Furthermore, a plateau in the absorbance/fluorescence signal could be reached in case the compound is completely converted.
A noninvasive solution for these limitations would be to measure cell viability optically, using the confluency as a measure of viability. Confluency measurements are not influenced by culture conditions, intrinsic metabolic activity and cell cycle phase, while they can be of influence for the absorbance or fluorescence level of the metabolic activity assays. Additionally, by taking microscopic images of the cultured cells at several time points the viability can be followed over time.
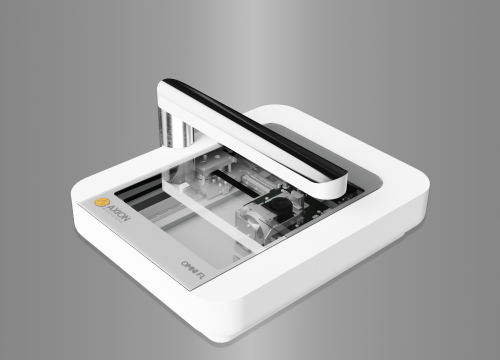
The CytoSMART® Omni is an automated live-cell imager that can be placed inside a regular CO2 -incubator for live-imaging of whole well plates over time. This live-cell imager allows for optimal culture conditions compared to conventional microscopes, since it is situated inside an incubator and the microscope itself moves at predefined intervals. Additionally, the (cloud-based) software of the CytoSMART® Omni provides direct storage and confluency analysis of the images.
The aim of this study was to compare the performance of the conventional (resazurin based) Cell Titer Blue assay with the confluency measurements obtained with the CytoSMART® Omni. As a proof-of-principle, PACO7 and PACO43 (pancreatic cancer cell lines) were treated with several doses of Paclitaxel (chemotherapy drug that affects the microtubules) for 72 h, after which the viability was measured using both methods.
Materials and Methods
Viability of PACO7 and PACO43 cells
PACO7 and PACO43 cells were seeded at a seeding density of 25,000 cells/cm2 and cultured for 24 h in a 96-well plate using culture medium consisting of Advanced DMEM-nutrient mixture F-12 (Life Technologies) supplemented with 1% N2 supplement (Life Technologies), 50ng/ml basic fibroblast growth factor (bFGF; Peprotech), 20 ng/ml epidermal growth factor (EGF; Peprotech), 10 ng/ml LONG R3 insulin-like growth factor-I (IGF-I; Sigma), 100 µM β-mercaptoethanol (Life Technologies), and 2 µg/ml heparin (Sigma). Thereafter, Paclitaxel was added to the samples at concentrations ranging between 100 µM and 1.7 nM (1:3 serial dilution; n=4 per concentration). After 72 h of incubation with Paclitaxel, the relative viability (viability compared to control samples) was determined using either the Cell Titer Blue assay or the CytoSMART® Omni as described below.
Confluency measurements using the CytoSMART® Omni
To enable confluency measurements, the 96-well plate containing the samples was placed on the CytoSMART® Omni which was placed inside an incubator (37°C and 5% CO2 ), and a scan of the complete well plate was made (Fig. 1A). The CytoSMART® image analysis software was used for well selection (Fig. 1B) and determining the confluency of each individual well (Fig. 1C). The confluency was normalized to the confluency of control samples to obtain the relative confluency (%) as a measure of cell viability.
Cell Titer Blue assay
Cell Titer Blue reagent (Promega) was added to the samples in a 1:5 ratio to the medium volume and incubated for 3 h at 37°C and 5% CO2 . Thereafter, the fluorescence intensity was measured at 560 nm excitation and 590 nm emission wavelengths. The fluorescence intensity was normalized to the control sample fluorescence intensity to obtain the relative metabolic activity (%) as a measure of cell viability.
Results
PACO7 and PACO43 cells were treated with increasing doses (1.7 nM to 100 µM) of Paclitaxel for 72 h. Thereafter, the metabolic activity and the confluency were determined as a measure of viability using respectively the Cell Titer Blue assay and the CytoSMART® Omni. Both the relative metabolic activity and the relative confluency of PACO7 cells gradually decreased with increasing doses of Paclitaxel (Fig. 2A and B). This led to a high correlation between both methods (R2 = 0.76, p < 0.001; Fig. 2C). Paclitaxel treatment of PACO43 cells led to a steep decrease of both viability curves with increasing doses up to 137 nM, after which the percentage of viable cells stayed relatively constant (Fig. 3D and E). The correlation between the two methods was again high (R2 = 0.79, p < 0.001; Fig. 3F).
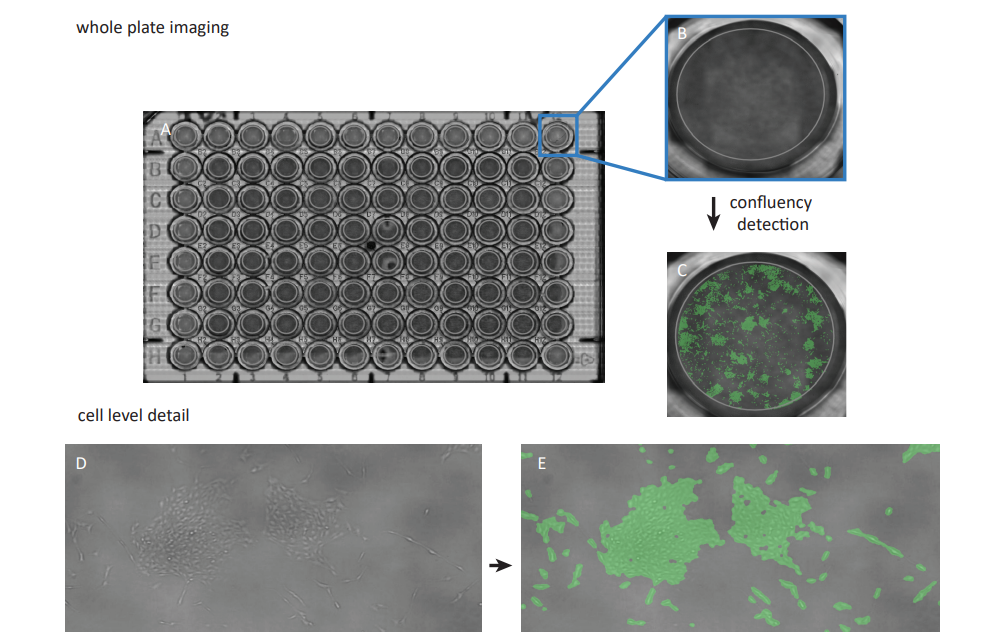
Figure 1. A scan of the whole well plate was made using the CytoSMART® Omni (A). Thereafter individual wells were selected (B) and the confluency was measured (C) Users can zoom in to cell level detail both in the bright-field view D) and the confluency data visualization E)
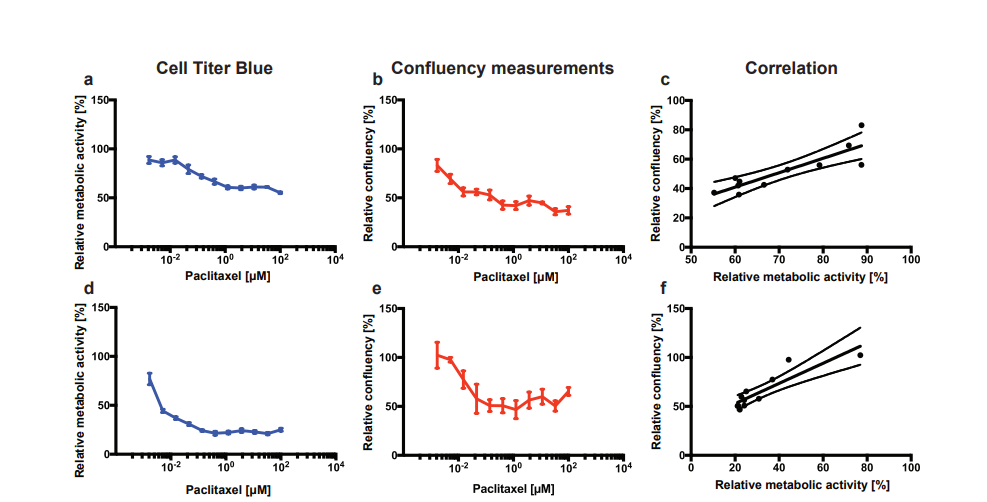
Figure 2. Relative viability of PACO7 (A, B) and PACO43 (D, E) cells upon addition of Paclitaxel measured either via relative metabolic activity using the Cell Titer Blue assay (A, D), or via relative confluency using the CytoSMART® Omni (B, E). The correlation between the mean viability measured with both methods is shown in C (R2 = 0.76, p < 0.001) and F (R2 = 0.79, p < 0.001). Error bars show the standard deviation.
Discussion
Assays that measure cell metabolic activity are often used to determine cell viability. However, the major drawback is that these assay reagents cannot be used to measure cell viability in real-time since the reagents are toxic or bleach over time. Measuring changes in confluency using bright-field microscopy could be a non-invasive method to follow changes in cell viability in real-time. Therefore, as a proof-of-principle, we compared the results of metabolic activity measurements using the Cell Titer Blue assay with confluency measurements obtained with the CytoSMART® Omni.
In this study, we showed that cell viability measured using brightfield microscopic imaging correlated well with conventional Cell Titer Blue measurements using PACO7 and PACO43 cells. Since both methods measure different properties of viable cells, the relative viability measures (relative metabolic activity and relative confluency) could not be compared directly. However, the correlation between the two methods was high for both the PACO7 and PACO43 cells, indicating that both methods capture the changes in viability well.
Even though the Cell Titer Blue assay and the confluency measurements capture changes in viability equally well, the confluency measurement has the major benefit that it is not influenced by factors such as culture conditions, cell type and cell cycle phase. Like with the Cell Titer Blue assay, the entire well was analyzed with the CytoSMART® Omni. This is generally not possible with conventional microscopes, that just take one image per well.
A limitation of the Cell Titer Blue assay is the eventual depletion of resazurin by metabolically active cells. This depletion will in turn lead to a plateau in the fluorescent intensity signal which will thus not represent the viability in a correct manner anymore in case of cells with a high intrinsic metabolic activity, high numbers of cells and/or lengthy viability measurements [3]. High numbers of cells, up to 100% confluency, are no limitation when using bright-field microscopy images to determine cell viability.
Conclusion
Summarizing, in this study, we compared cell viability measurements using the Cell Titer Blue assay and confluency measurements. We showed that the confluency measurements correlate well with the Cell Titer Blue assay. Furthermore, unlike in the Cell Titer Blue assay, the confluency measurements are not influenced by culture conditions, cell type and cell cycle phase. Because of these benefits and the non-invasive nature of confluency measurements, the CytoSMART® Omni could be a suitable device for real-time monitoring of cell viability studies.
References
[1] T. Mosmann, “Rapid colorimetric assay for cellular growth and survival: Application to proliferation and cytotoxicity assays,” J. Immunol. Methods, vol. 65, no. 1–2, pp. 55–63, 1983.
[2] S. Ansar Ahmed, R. M. Gogal, and J. E. Walsh, “A new rapid and simple non-radioactive assay to monitor and determine the proliferation of lymphocytes: an alternative to [3H]thymidine incorporation assay,” J. Immunol. Methods, vol. 170, no. 2, pp. 211–224, 1994.
[3] T. L. Riss et al., “Cell Viability Assays,” in Assay Guidance Manual [Internet], vol. 114, no. 8, K. Sittampalam, G. S.; Coussens, N.P.; Brimacombe, Ed. Bethesda (MD): Eli Lilly & Company and the National Center for Advancing Translational Sciences, 2013, pp. 785–796.
[4] S. N. Rampersad, “Multiple applications of alamar blue as an indicator of metabolic function and cellular health in cell viability bioassays,” Sensors (Switzerland), vol. 12, no. 9, pp. 12347–12360, 2012.
[5] A. A. Stepanenko and V. V. Dmitrenko, “Pitfalls of the MTT assay: Direct and off-target effects of inhibitors can result in over/ underestimation of cell viability,” Gene, vol. 574, no. 2, pp. 193–203, 2015.