Introduction
Cell differentiation is a crucial part of development and repair of tissues. The differentiation of cells is commonly distinguished through the presence of differentiation markers, such as proteins produced by differentiated cells [1]. These markers are then detected using techniques such as immunofluorescence microscopy and flow cytometry [2]. A downside of these techniques is that they usually require expensive fluorescently- labeled antibodies. Furthermore, these are end-point measurements. This means measuring the differentiation of cells over time requires a large number of samples, resulting in a labor- intensive process that requires a large number of disposables and expensive antibodies.
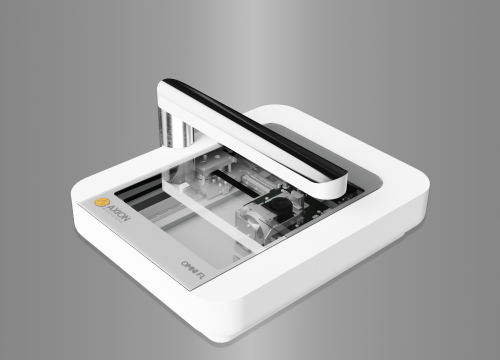
An alternate approach to measure cell differentiation is by observing their morphology [3]. Advantages of this approach include that these measurements can be performed on live cells, and that they do not require additional materials. Furthermore, due to the use of live cells the same population of cells can be monitored over longer periods of time, eliminating reproducibility issues resulting from the use of different samples per timepoint. However, performing live-cell morphology measurements using brightfield microscopy is not without issues. Cells have to be removed from the incubator for every time-step, this means frequent temperature, gas and mechanical shocks to the cells. Alternately, a stage top incubator can be used, however the moving stage still results in mechanical shock on the cells as they are moved over the lens of the microscope. The CytoSMART® Omni is an automated live-cell imager that can be placed inside a regular CO 2 -incubator for live-imaging of whole well plates over time. This live-cell imager allows for optimal culture conditions compared to conventional microscopes, since it is situated inside an incubator and the microscope itself moves at predefined intervals. Additionally, the (cloud-based) software of the CytoSMART® Omni provides direct storage of the images.
The aim of this study was to observe the differentiation of cells through a change in their morphology over time. As a proof-of-principle, elongated primary corneal fibroblasts were exposed to media conditions that stimulated differentiation to a circular myofibroblastic phenotype for 10 days, with shape measurements being performed every 12 hours
Materials and Methods
A 96-well optical-bottom plate with polymer base (Thermo Scientific Nunc) was seeded with primary corneal fibroblasts (3125 cells/ cm2 ) in expansion medium (EXP) consisting of DMEM:F12 (Gibco) supplemented with 5% FBS (Gibco), 1% penicillin-streptomycin (Gibco) and 1 mM Vitamin-C (Invitrogen). After 24 h of culture (37 °C and 5% CO2 ) EXP was replaced with EXP supplemented with 0-100 ng/ml transforming growth factor β1 (Thermo Fischer Scientific), or with differentiation medium (DIF) consisting of DMEM (Gibco) supplemented with 1% penicillin-streptomycin, 1% Glutamax (Gibco), 1% insulin-transferrin-selenium (Gibco), 2 mg/ml D-glucose (Invitrogen), 2.5 mg/ml D-mannitol (Fluka) and 1 mM Vitamin-C (Invitrogen) supplemented with 0-100 ng/ml transforming growth factor β1 (Thermo Fischer Scientific).
Samples were placed on a CytoSMART® Omni for live-cell imaging with a time interval of 12 hours for 240 hours. Circularity and aspect ratio were measured every 12 hours using ImageJ by manually tracing 20 randomly selected cells per sample for the time-response experiment, or 10 randomly selected cells per sample for the doseresponse experiment (Fig. 1). Data was analyzed in GraphPad Prism v5.04. The differences between populations were analyzed using a two-way ANOVA with a Bonferroni multiple comparisons test.
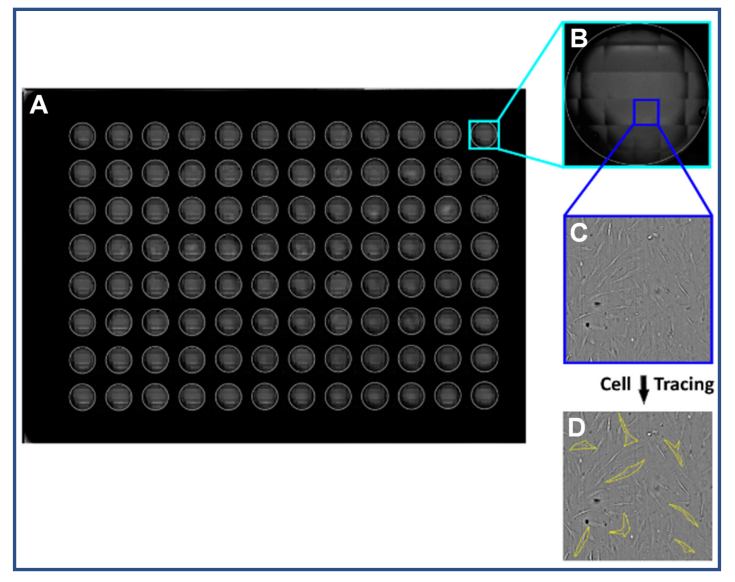
Fig. 1: A scan was made of the whole well plate using a CytoSMART® Omni (A). A well was selected for each media condition (B). An image was taken from the selection at the cellular detail level (C). A random selection of cells were manually traced to measure the circularity and aspect ratio (D)
Results
A live-cell time-lapse of primary corneal fibroblasts exposed to TGF-β1 (0, 0.1, 1.0 ng/ml) was made to gain more insight into the differentiation of primary corneal fibroblasts to myofibroblasts (Fig. 2). Primary corneal fibroblasts were cultured with TGF-β1 in EXP for 240 hours. It was demonstrated that primary corneal fibroblasts exposed to TGF-β1 take on a myofibroblastic shape over the course of 240 hours.
A TGF-β1 titration was performed to find the effective concentration of TGF-β1 at which primary corneal fibroblasts start to switch to a myofibroblastic shape (Fig. 3). Cells cultured in DIF with TGF-β1 concentrations exceeding 1.0 ng/ml underwent apoptosis before the final time point was reached. Cells cultured in EXP with TGF-β1 concentrations exceeding 5.0 ng/ml started contracting into a 3-dimensional (3D) shape after 140 hours, making the aspect ratio and circularity measurements impossible (Fig. 4). Therefore, the aforementioned samples are excluded from Figure 3.
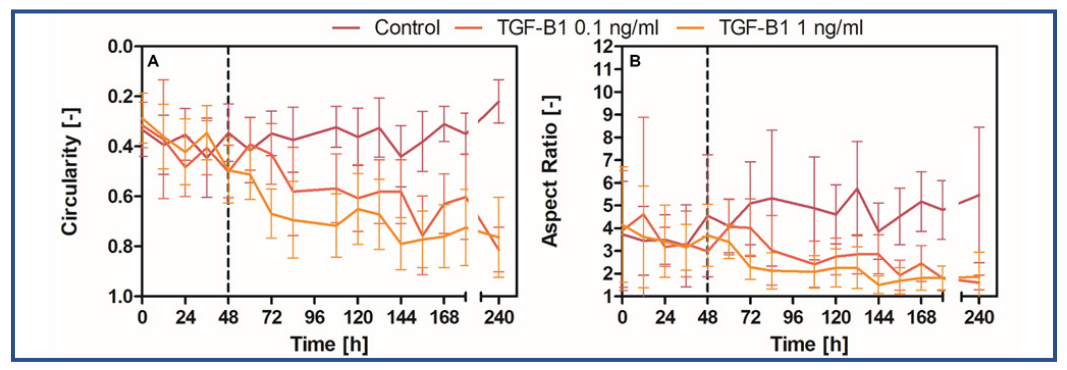
Fig. 2: The circularity (A) and aspect ratio (B) of cells in response to the addition of TGF-β1 (n=20). The dashed line at t=48 hours represents the point at which a confluence of 100% was reached. Error bars show the standard deviation.
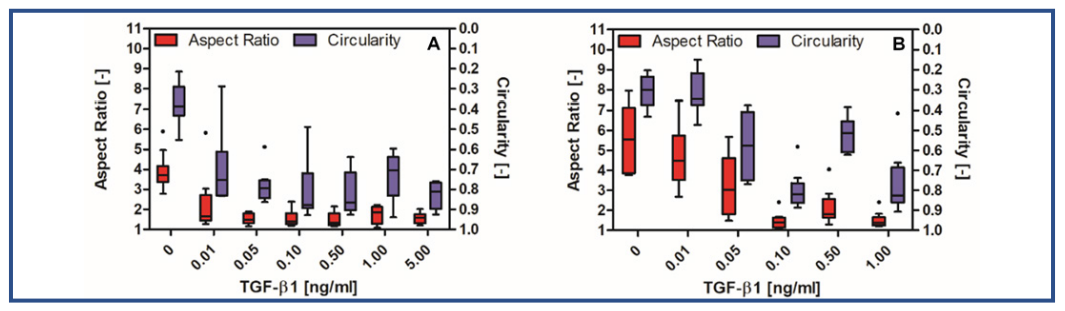
Fig. 3: A Tukey plot of the aspect ratio (red) and circularity (blue) of cells in response to different concentrations of TGF-β1 in EXP (A) or DIF (B) after 240 hours (n=10).
It was demonstrated that primary corneal fibroblasts cultured in EXP with concentrations of TGF-β1 ≥ 0.05 ng/ml underwent differentiation to a myofibroblastic shape with a low circularity and aspect ratio (Fig. 3A). The difference between cells cultured in EXP without TGF-β1 and cells cultured in EXP with TGF-β1 ≥ 0.05 ng/ml was statistically significant (p < 0.05). This indicated that for cells cultured in the presence of FBS there is a threshold of at least 0.05 ng/ml TGF-β1 required to initiate differentiation towards a myofibroblastic shape. For cells cultured in DIF with TGF-β1 this threshold was at 0.10 ng/ml TGF-β1 (Fig. 3.5B). The difference between cells cultured in DIF and EXP with TGF-β1 may indicate that TGF-β1 and FBS play a cumulative role in the differentiation towards myofibroblasts.
Cells cultured in EXP, which contains FBS, were able to survive up to the highest measured concentration of TGF-β1 (100 ng/ ml). However, at concentrations of TGFβ1 ≥ 10.0 ng/ml the cells started contracting after 140 hours (Fig. 4A), and subsequently contracted into a 3D spheroid over the course of ±25 hours (Fig. 4). a viability measurement of one of these spheroids showed that the majority of the cells (60.8%) were viable. Cells cultured in DIF with concentrations of TGF-β1 ≥ 10 ng/ml underwent apoptosis. This indicated that FBS likely plays a protective or a buffering role against TGF-β1.
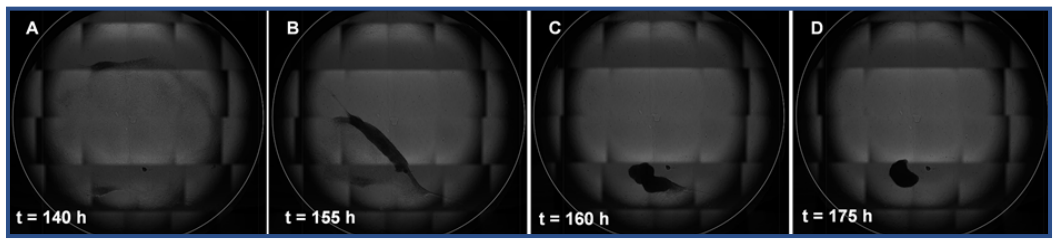
Fig. 4: The contraction of cells in a monolayer to a spheroid can be observed as a result of exposure to 10 ng/ml TGF-β1 for 140-175 hours (A-D)
Discussion
Cell differentiation is usually examined through the presence of differentiating proteins or gene expression. However, this has two major drawbacks. First, the cells have to be killed to obtain the results, therefore the differentiation of a single population cannot be followed over time. Second, the detection of differentiation markers typically requires fluorescentlylabeled antibodies, which are expensive and labor intensive. Therefore, the morphology of cells was used to demonstrate the differentiation of primary corneal fibroblasts to myofibroblasts. In this study, we showed that exposure to TGF-β1 causes primary corneal fibroblasts to take on both a myofibroblastic shape and the contractile behavior typical of myofibroblasts. It was possible to follow the differentiation of the cells over time using live-cell imaging. Furthermore, it was possible to observe the contraction of the cells through the use of live-cell imaging. Two possible thresholds for differentiation were determined: 0.05 ng/ml for the myofibroblastic shape and 10 ng/ml for the contractile behavior. Which of these two thresholds most accurately describes the complete differentiation of corneal fibroblasts to myofibroblasts remains to be tested with conventional methods. This could include immunofluorescence microscopy or flow cytometry for α-smooth muscle actin, which is a differentiation marker for myofibroblasts [1].
Conclusion
In summary, in this study we demonstrated that exposure to TGF-β1 caused a change of shape and contractility in corneal fibroblasts that is in line with the shape and behavior of corneal myofibroblasts. We showed that the change in shape can be observed as a dose-response relationship. Furthermore, we demonstrated that using live-cell imaging it is possible to follow the change in shape of a single population of cells over time in a label-free fashion. Therefore, the CytoSMART® Omni could be a suitable device for real-time monitoring of cell differentiation.
References
[1] He, J. & Bazan, H. E. P. Epidermal growth factor synergism with TGF-β1 via PI-3 kinase activity in corneal keratocyte differentiation. Investig. Ophthalmol. Vis. Sci. 49, 2936–2945 (2008).
[2] Hashmani, K., Branch, M.J., Sidney, L.E. et al. Characterization of corneal stromal stem cells with the potential for epithelial transdifferentiation. Stem Cell Res Ther 4, 75 (2013).
[3] Lakshman, N., Kim, A., & Petroll, W. M. (2010). Characterization of corneal keratocyte morphology and mechanical activity within 3-D collagen matrices. Experimental eye research, 90(2), 350–359