Introduction
Using live-cell imaging, researchers are able to determine not only whether, but also when and how certain cellular events occur in culture. The number of read-outs and consequently the obtained information from one live-cell imaging experiment can be increased by including one or multiple fluorescent probe(s) and corresponding imaging channel(s), besides the standard brightfield channel.
In co-cultures, fluorescence imaging facilitates distinction of the included cell types and (quantified) read-outs per cell type, by assigning each cell type a particular fluorescent label [1]. Co-culture setups are commonly applied in cancer research, since tumors and their environment involve many different cell types: e.g., immune cells aim for elimination of the cancer cells [2], endothelial cells are stimulated to vascularize a tumor [3], and fibroblasts can either promote or inhibit tumor growth [4-6]. A commonly determined read-out in this context is the confluence per cell type, which provides insight into interactions between the different cell types; these can either support each other during the proliferation stage or compete and eliminate each other [1].
How the cells specifically affect each other often relates to the ratio of the various cell types in a tissue environment, where the most abundantly present cell type is generally dominant, but this depends on the specific interaction and the cell types involved [7]. Fundamental knowledge involving such interactions can be relevant in e.g., cancer research, where potential clinical therapies could be based on insight in interactions between cancer cells and surrounding other cell types. However, this insight requires an imaging system that enables fluorescence live-cell imaging of the co-cultures over time.
The most common fluorescence live-cell imaging setup is currently a fluorescence microscope, with a stage top incubation box to regulate the culture conditions. However, there are practical issues when using a high-end microscope for live-cell imaging. The regulation of the culture conditions in the incubation box is more sensitive to variations compared to a dedicated incubator [8, 9]. This variability may disturb the cultures and can distort the results [10, 11]. Besides that, images are only captured at certain time points, but the microscope is unavailable for other users during the entire live imaging experiment.
The CytoSMART Lux3 FL Duo Kit could overcome these issues. This system fits in a regular incubator, and therefore enables two-channel fluorescence live-cell imaging (green, red) in a constant and optimal culture environment. By connecting two devices within the same incubator to a single laptop, two cultures can be monitored simultaneously and compared side-by-side without temporal or inter-sample variation in temperature and CO2 level.
In this proof-of-concept study, we determine the effect of the seeding ratio on proliferation of a cancer cell line and fibroblasts in co-culture, using side-by-side fluorescence live-cell imaging. The CytoSMART Lux3 FL Duo Kit and corresponding cloud-based image analysis algorithm for brightfield and fluorescence channel confluence were applied. With these tools, the confluence over time of fluorescently labeled MDA-MB-231 cells (metastatic breast cancer cell line) and 3T3 cells (fibroblasts) in co-cultures with two different seeding ratios was determined. This provided fundamental insight into interactions between the cell types, which may ultimately be related to tumor growth.
Materials and methods
tFP602-labeled MDA-MB-231 cells (Innoprot P20317; red fluorescent) and non-fluorescent 3T3 fibroblasts (ATCC® CL173™) were separately cultured to sub-confluency in DMEM (Gibco) supplemented with 10% FBS (Gibco) and 1% pen-strep (Gibco), under standard culture conditions (37°C; 5% CO2 ). Co-cultures of MDA-MB-231 cells and 3T3 fibroblasts were seeded in 24-well plates at a total density of 50,000 cells per well, at ratios of 1:1 and 1:10 (MDA-MB-231 : 3T3).
Co-cultures were monitored for 2 days using the CytoSMART Lux3 FL Duo Kit (37°C; 5% CO2 ), with a 1 h interval. At each time point, the brightfield and red fluorescence channel were imaged. Confluence per cell type was determined using the integrated algorithm in the CytoSMART Cloud.
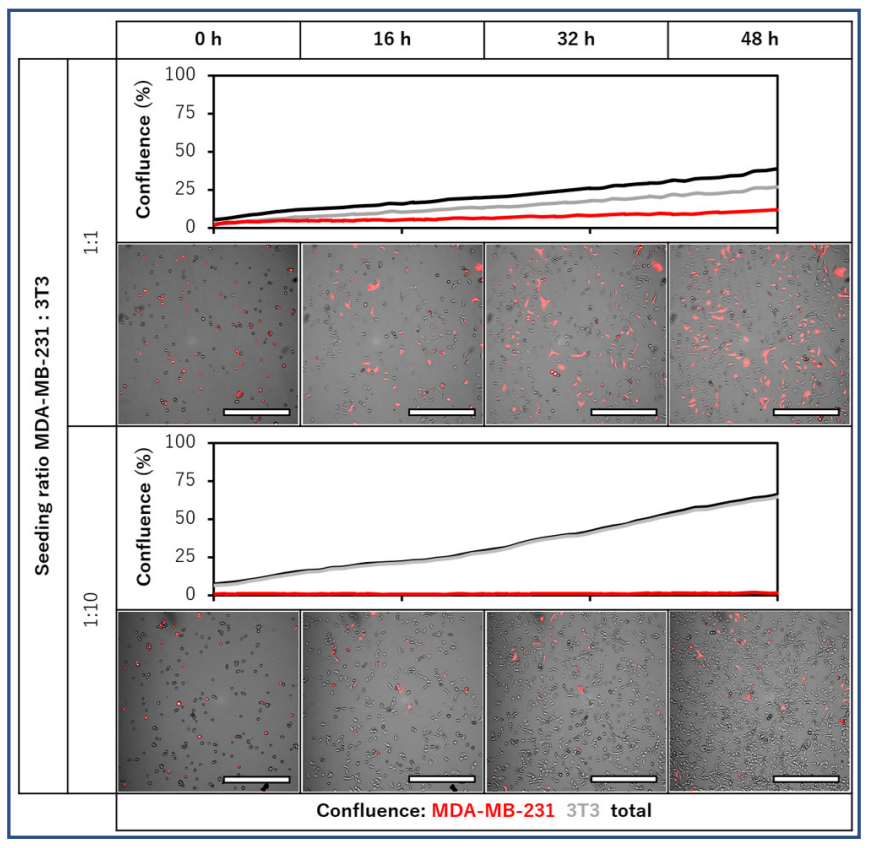
Fig. 1. Side-by-side comparison of confluence per cell type in MDA-MB-231 – 3T3 co-cultures. Red fluorescent MDA-MB-231 cells and non-fluorescent 3T3 fibroblasts were seeded at 1:1 or 1:10 ratios, and monitored during 48 h with a 1 h imaging interval. Confluence per cell type was determined from confluence per imaging channel. Scale bar = 500 µm.
Results
mages from the time-lapse videos of the two seeding ratios, as well as the determined confluence per cell type over time are displayed in Fig. 1. In the 1:1 seeding ratio, both cell types proliferated, but total confluence after 2 days was lower than for the 1:10 condition. For this 1:1 seeding ratio, the final ratio of MDA-MB-231 : 3T3 was approximately 3:7. In the 1:10 condition, only the 3T3 fibroblasts proliferated, and confluence of the MDA-MB-231 cells did not increase over time. The final ratio of MDA-MB-231 : 3T3 was approximately 1:40.
Discussion
Fluorescence live-cell imaging enables distinction of cell types in co-cultures, when certain included cell types are assigned a particular fluorescent label. This can provide fundamental knowledge regarding cell types either supporting each other’s proliferation or competing and eliminating each other, which can serve as base for potential therapies in e.g., cancer research. However, application of fluorescence live-cell imaging in such fundamental co-culture experiments is limited due to various (practical) issues: the culture environment inside a stage-top incubation box on a high-end fluorescence microscope is generally regulated sub-optimally, and images are only captured at certain intervals whereas the high-end microscope is occupied during the entire experiment. Therefore, we aimed to demonstrate the use of the CytoSMART Lux3 FL Duo Kit for long-term side-by-side comparison experiments with fluorescence live-cell imaging, and investigate the interactions in cell proliferation in co-cultures of MDA-MB-231 cells with 3T3 fibroblasts.
The existing practical issues of fluorescence live-cell imaging were overcome in our experimental setup with the CytoSMART Lux3 FL Duo Kit. The compact system enabled the cells to be cultured in the optimal and consistent environment, and minimized temporal and inter-sample variability. Consequently, comparison of conditions was straightforward and as accurate as possible. Besides that, the dedicated devices for long-term time-lapse imaging provided optimal efficiency in use of devices, leaving high-end microscopes available for (continuous) imaging in other experiments.
The confluence quantifications over time indicated competition between the MDA-MB-231 cells and the 3T3 cells. However, the initial ratio determined whether proliferation for both cell types was relatively low, or only MDA-MB-231 cells were eliminated. In previous research, it was found that metabolic rates of tumor cells in co-culture were lower than in monocultures [5], and that regular fibroblasts can prevent tumor growth [6]. These effects are similar to the observed behavior of the 3T3 cells in the skewed seeding ratio in our research. However, certain papers report specific fibroblasts supporting and accelerating tumor growth. These cells are therefore named cancer-associated fibroblasts [6]. Opposite to the inhibitory property of regular fibroblasts, cancer-associated fibroblasts are more active, and thereby create an optimal environment for tumor cells to grow. In our research, the 3T3 fibroblasts apparently acted as regular fibroblasts and prevented MDA-MB-231 proliferation, and the Lux3 FL Duo Kit clearly revealed these fibroblast properties.
Conclusion
In this study, we provided a successful proof-of-concept for the use of fluorescence live-cell imaging in simultaneous monitoring of cell confluence throughout a co-culture experiment with various seeding ratios. Confluence measurements for both channels (brightfield, green) and all conditions could be performed simultaneously and fully automatically with the integrated image analysis of the CytoSMART Multi Lux3 FL. This revealed elimination of 3T3 fibroblasts by HeLa cells in a co-culture, where the initial seeding ratio determined how long the 3T3 cells could proliferate before elimination.
References
[1] M. D. Lavender, Z. Pang, C. S. Wallace, L. E. Niklason and G. A. Truskey. “A system for the direct co-culture of endothelium on smooth muscle cells,” Biomaterials, vol. 26, no. 22, pp. 4642-4653, 2005.
[2] V. O. Pimentel, A. Yaromina, D. Marcus, L. J. Dubois and P. Lambin. “A novel co-culture assay to assess anti-tumor CD8+ T cell cytotoxicity via luminescence and multicolor flow cytometry,” J. Immunol. Methods, vol. 487, no. 112899, 2020.
[3] J. A. Nagy, S. H. Chang, S. C. Shih, A. M. Dvorak and H. F. Dvorak. “Heterogeneity of the tumor vasculature,” Semin. Thromb. Hemost., vol. 36, no. 3, pp. 321-331, 2010.
[4] J. G. Delinasios, F. Angeli, G. Koumakis, S. Kumar, W. H. Kang, G. Sica, F. Iacopino, G. Lama, S. Lamprecht, I. Sigal-Batikoff, G. T. Tsangaris, C. D. Farfarelos, M. C. Farfarelos, E. Vairaktaris, S. Vassiliou and G. J. Delinasios. “Proliferating fibroblasts and HeLa cells co-cultured in vitro reciprocally influence growth patterns, protein expression, chromatin features and cell survival,” Anticancer Res., vol. 35, no. 4, pp. 1881-1916, 2015.
[5] D. Chen, H. Wang, P. Liu, L. Song, J. Shi, B. Tong and Y. Dong. “The application of CO2-sensitive AIEgen in studying the synergistic effect of stromal cells and tumor cells in a heterocellular system,” Anal. Chim. Acta, vol. 1001, pp. 151-157, 2018.
[6] T. Alkasalias, L. Moyano-Galceran, M. Arsenian-Henriksson and K. Lehti. 2018. “Fibroblasts in the tumor microenvironment: shield or spear?,” Int. J. Mol. Sci., vol. 19, no. 1532, 2018.
[7] L. Ombrato, E. Nolan, D. Passaro, I. Kurelac, V. L. Bridgeman, A. Waclawiczek, D. Duarte, C. L. Celso, D. Bonnet and I. Malanchi. “Generation of neighbor-labeling cells to study intercellular interactions in vivo,” Nat. Protoc., vol. 16, no. 2, pp. 872-892, 2021.
[8] M. M. Frigault, J. Lacoste, J. L. Swift and C. M. Brown. “Live-cell microscopy–tips and tools,” J. Cell Sci., vol. 122, no. 6, pp.753-767, 2009.
[9] A. Ettinger and T. Wittmann. “Fluorescence live cell imaging,” Methods Cell Biol., vol. 123, pp. 77-94, 2014. [10] J. Michl, K. C. Park and P. Swietach. “Evidence-based guidelines for controlling pH in mammalian live-cell culture systems,” Commun. Biol., vol. 2, no. 144, 2019.
[11] E. M. Levine and E. B. Robbins. “Differential temperature sensitivity of normal and cancer cells in culture,” J. Cell. Physiol., vol. 76, no. 3, pp. 373-379, 1970