Introduction
Cultured cells are used in many different research laboratories, e.g. in the fields of drug discovery, regenerative medicine and tissue engineering. Many variables can influence the growth and function of cells in culture. Some of the variables cannot be controlled because they are inherent to the stochastic processes in biological systems. However, variables such as temperature, CO2-level, seeding density and media components can be controlled. These variables should be optimized for each cell type to standardize the culture process and obtain the optimum cell growth.
Cell culture optimization is generally done by manual inspection of cell growth. When monitoring the cell culture manually, assessment of the culture quality is usually made at random positions in the culture vessel and at variable time intervals (e.g. every day except during the weekend). Furthermore, assessment of cell growth is generally qualitative and user dependent since the user has to make an estimate of the confluency (cell coverage) by eye. Next to this, cells experience temperature and CO2- fluctuations every time they are taken out of the temperature controlled CO2-incubator for inspection.
The CytoSMART® Omni is an automated live-cell imager that provides a non-invasive solution for the above mentioned issues. In contrast to manual monitoring of cell growth, the CytoSMARTTM Omni takes bright-field images of the entire culture vessel and automatically analyses the confluency of the cells, directly inside the incubator. The precise calculation of confluency of the entire cell culture at regular, predefined, intervals creates objective growth curves that can be used for optimization of your cell culture protocol. Additionally, the cloud-based storage of the data obtained with the CytoSMART® Omni provides the ability to retrieve data months or years later for comparison of cell lines or cell growth characteristics.
In this study, we investigated the effect of seeding density on the growth of CHO-K1 (Chinese Hamster Ovary-K1) cells using the CytoSMART® Omni. Using the growth curves created with the automated image analysis software, the optimum seeding density of CHO-K1 cells can be determined
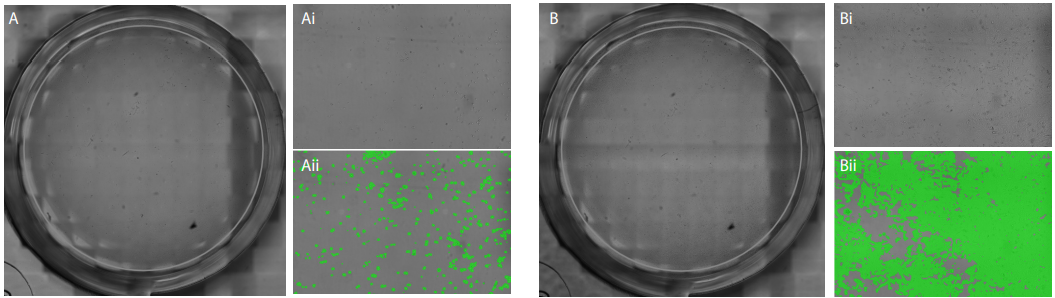
Figure 1. A and B: Full well images of a representative wells with a seeding density of 2,600 cells/cm2 (A) and 36,400 cells/cm2 (B) at the last time point. Ai and Bi: zoomed in image of the blue box in A and B. Aii and Bii: zoomed in image with a green overlay of the confluency mask.
Materials and Methods
CHO-K1 cells were seeded in a 48-well plate at different densities ranging from 2,600 to 36,400 cells/cm2 in HAM’s F12 nutrient mixture supplemented with 10% FBS and 1% penicillinstreptomycin (n=6 for each group). Immediately after seeding, the 48-well plate containing the samples was placed on the CytoSMART® Omni which was placed inside an incubator (37°C and 5% CO2 ; Fig 2.). For the duration of 70 hours, the complete well plate was imaged every two hours. The CytoSMART® image analysis software was used for well detection and determining the confluency of each individual well.
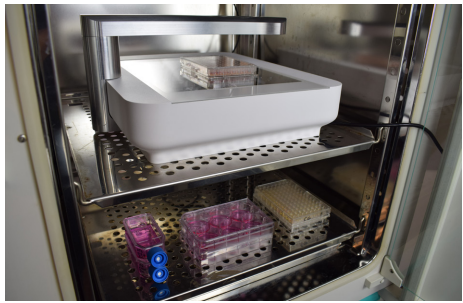
Figure 2. The well plate is placed on the CytoSMART® Omni situated inside an incubator.
Results
The CytoSMARTTM image analysis software successfully detected each well (Fig. 1A and B) and accurately determined the confluency in each well (Fig. 1Ai - Bii). The variation in seeding density-dependent cell growth is clearly seen in Fig. 3. The three lowest seeding densities show a gradual increase in confluency with a maximum confluency of 24% (2,600 cells/ cm2 ), 43% (5,200 cells/cm2 ), and 75% (10,400 cells/cm2 ) after 70 hours. No differences in confluency were seen between the seeding densities of 15,600 cells/cm2 , 20,800 cells/cm2 and 26,000 cells/cm2 . Both of the highest seeding densities reached approximately 100% confluency after 50 hours, without any differences in confluency.
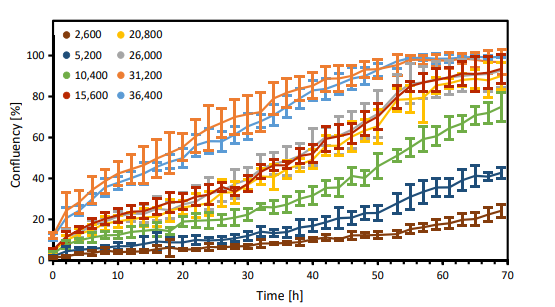
Figure 3. Growth curves of CHO-K1 cells seeded at increasing seeding densities (cells/ cm2 ; n=6 per group).
Discussion and Conclusion
Manual inspection of cell growth is generally qualitative and subjective, which makes optimization of cell culture a troublesome process. Cell culture optimization can be made objective and quantitative by using real-time live-cell imaging and analysis of the cell culture at set intervals.
Here, we have shown the variation in cell growth caused by differences in seeding density. Depending on the seeding density, the cells reached 100% confluency after 70 hours. The most steady growth until a confluency of almost 100% was obtained with seeding densities ranging from 15,600 to 26,000 cells/cm2.
Using the CytoSMART® Omni and its image analysis software, quantitative and objective growth curves were obtained to determine the optimum seeding density of CHO-K1 cells. This results in more accurate data of the cell growth since all cells were analyzed at set time intervals compared to manual, subjective, observation of the cell growth at random time intervals. Next to this, since the cells did not have to be taken out of the incubator for imaging, the cells were cultured at the optimum culture conditions.
Summarizing, using real-time live-cell imaging can be beneficial for accurate and quantitative optimization of cell culture protocols.