Mammalian cell culture is a versatile technique used in the biomedical sciences. In the field of cell metabolism, cell culture models are utilized to delineate metabolic signaling pathways that are dysregulated in disease (e.g. cancer, diabetes) and to identify novel targets for therapy.
Importantly, preclinical studies that evaluate the toxicity of new chemotherapeutic agents rely on in vitro cell viability assays, and the results obtained from those studies determine whether a drug is further tested in vivo and eventually in human trials. Thus, errors or inconsistencies during cell culture can derail investigations of the pathogenesis of human disease and drastically slow down the discovery of novel treatment strategies.
Problems with inconsistencies in cell culture models are becoming evident. We are in a reproducibility crisis. We have been for almost a decade. According to multiple reports, 50-89% of published studies are irreproducible (Figure 1).
The high rate of irreproducibility stimulated the formation of The Reproducibility Project: Cancer Biology (RP:CB) in 2014. The objective of this group was to reproduce 50 high-impact cancer biology papers (https://www.cos.io/rpcb). This ambitious project was supposed to take one year. Flash forward to 2018, and the Project had to reduce the number of projects to 18. Why did they decide to give up trying to reproduce the other 32 projects? Many of the published work lacked certain methodological details. One detail that was often missing was the density of cells that were plated for each experiment. As a result, the group had to test multiple plating densities for each study. The studies that took too long to troubleshoot and optimize were dropped.
Ten (10) out of 18 studies have been completed and the results are published in eLife (https://elifesciences.org/collections/9b1e83d1/reproducibility-project-cancer-biology). Out of the 10 studies, only 5 were mostly repeatable. Other groups, however, were able to reproduce the original findings. These conflicting reports provide an important lesson. Inconsistency in culturing conditions has huge implications for the research that follows.
In this article, we will present two studies that demonstrate the impact of inconsistent cell culturing conditions on the results of cell metabolism assays and then end with a brief discussion of modern techniques that may help control for this confounding variable.
Study 1: Cell density influences optical readouts of metabolism
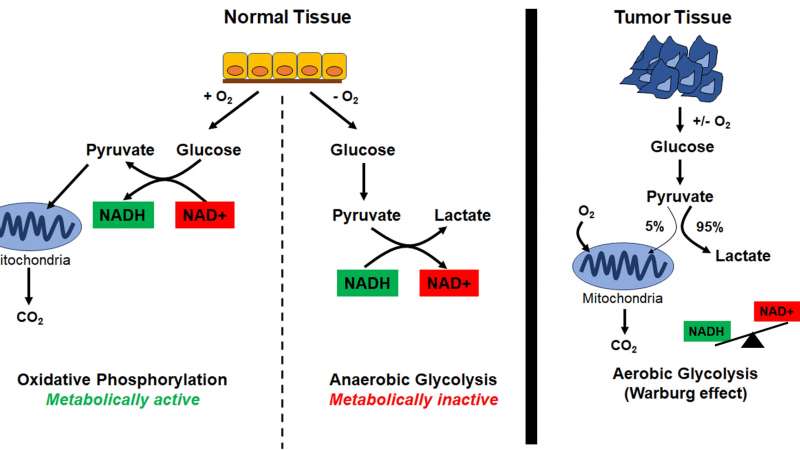
Metabolically active cells (i.e. cells that are proliferating) utilize oxygen to produce glucose, which then gets processed into pyruvate. Pyruvate is utilized by the mitochondria as fuel to drive ATP production by oxidative phosphorylation. For pyruvate production, cells need NADH; thus, metabolically active cells have high levels of NAD(P)H (Figure 2).
In contrast, metabolically inactive cells (i.e. cells that are no longer proliferating, due to a deficit of nutrients) utilize pyruvate to generate lactate. This process, also known as anaerobic glycolysis, results in the production of NAD+. Therefore, metabolically inactive cells have higher levels of NAD+ (Figure 2).
Cancer cells, however, metabolize most of their pyruvate to generate lactate through a process called aerobic glycolysis or the Warburg effect, regardless of the availability of oxygen (Figure 2).
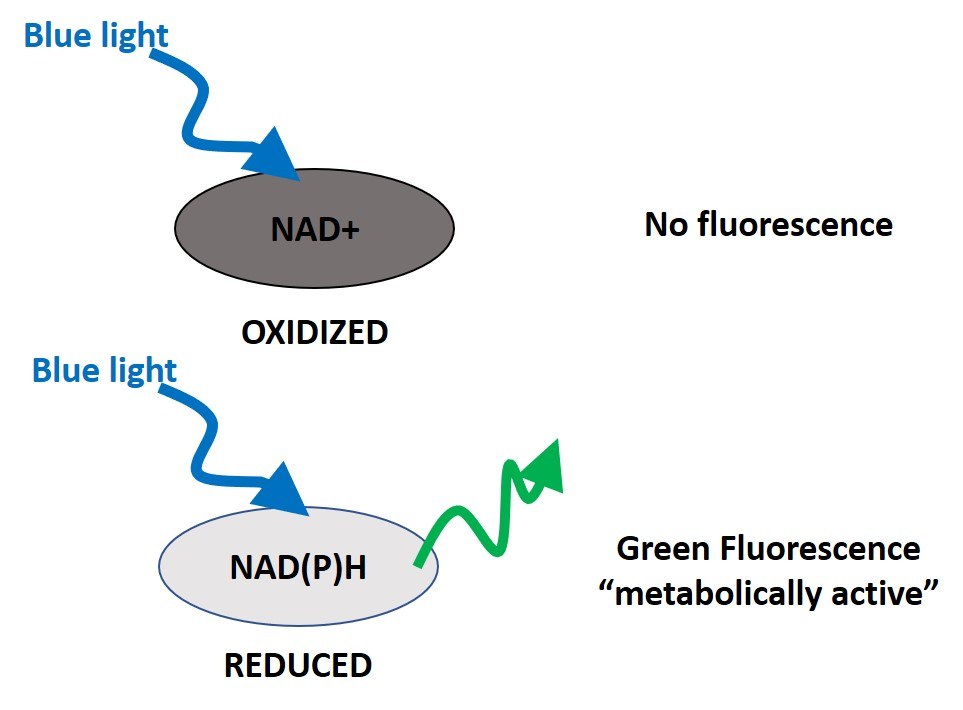
Autofluorescence imaging (AFI)-fluorescence lifetime imaging microscopy (FLIM) is an optical assay to evaluate the metabolic state of a cell or tissue. In preclinical studies, AFI-FLIM has been used to distinguish healthy from pathological tissues. It does so by relying on the fact that NAD(P)H (reduced) naturally emits green fluorescence when exposed to blue light (340-390nm), while NAD+ (oxidized) does not (Figure 3).
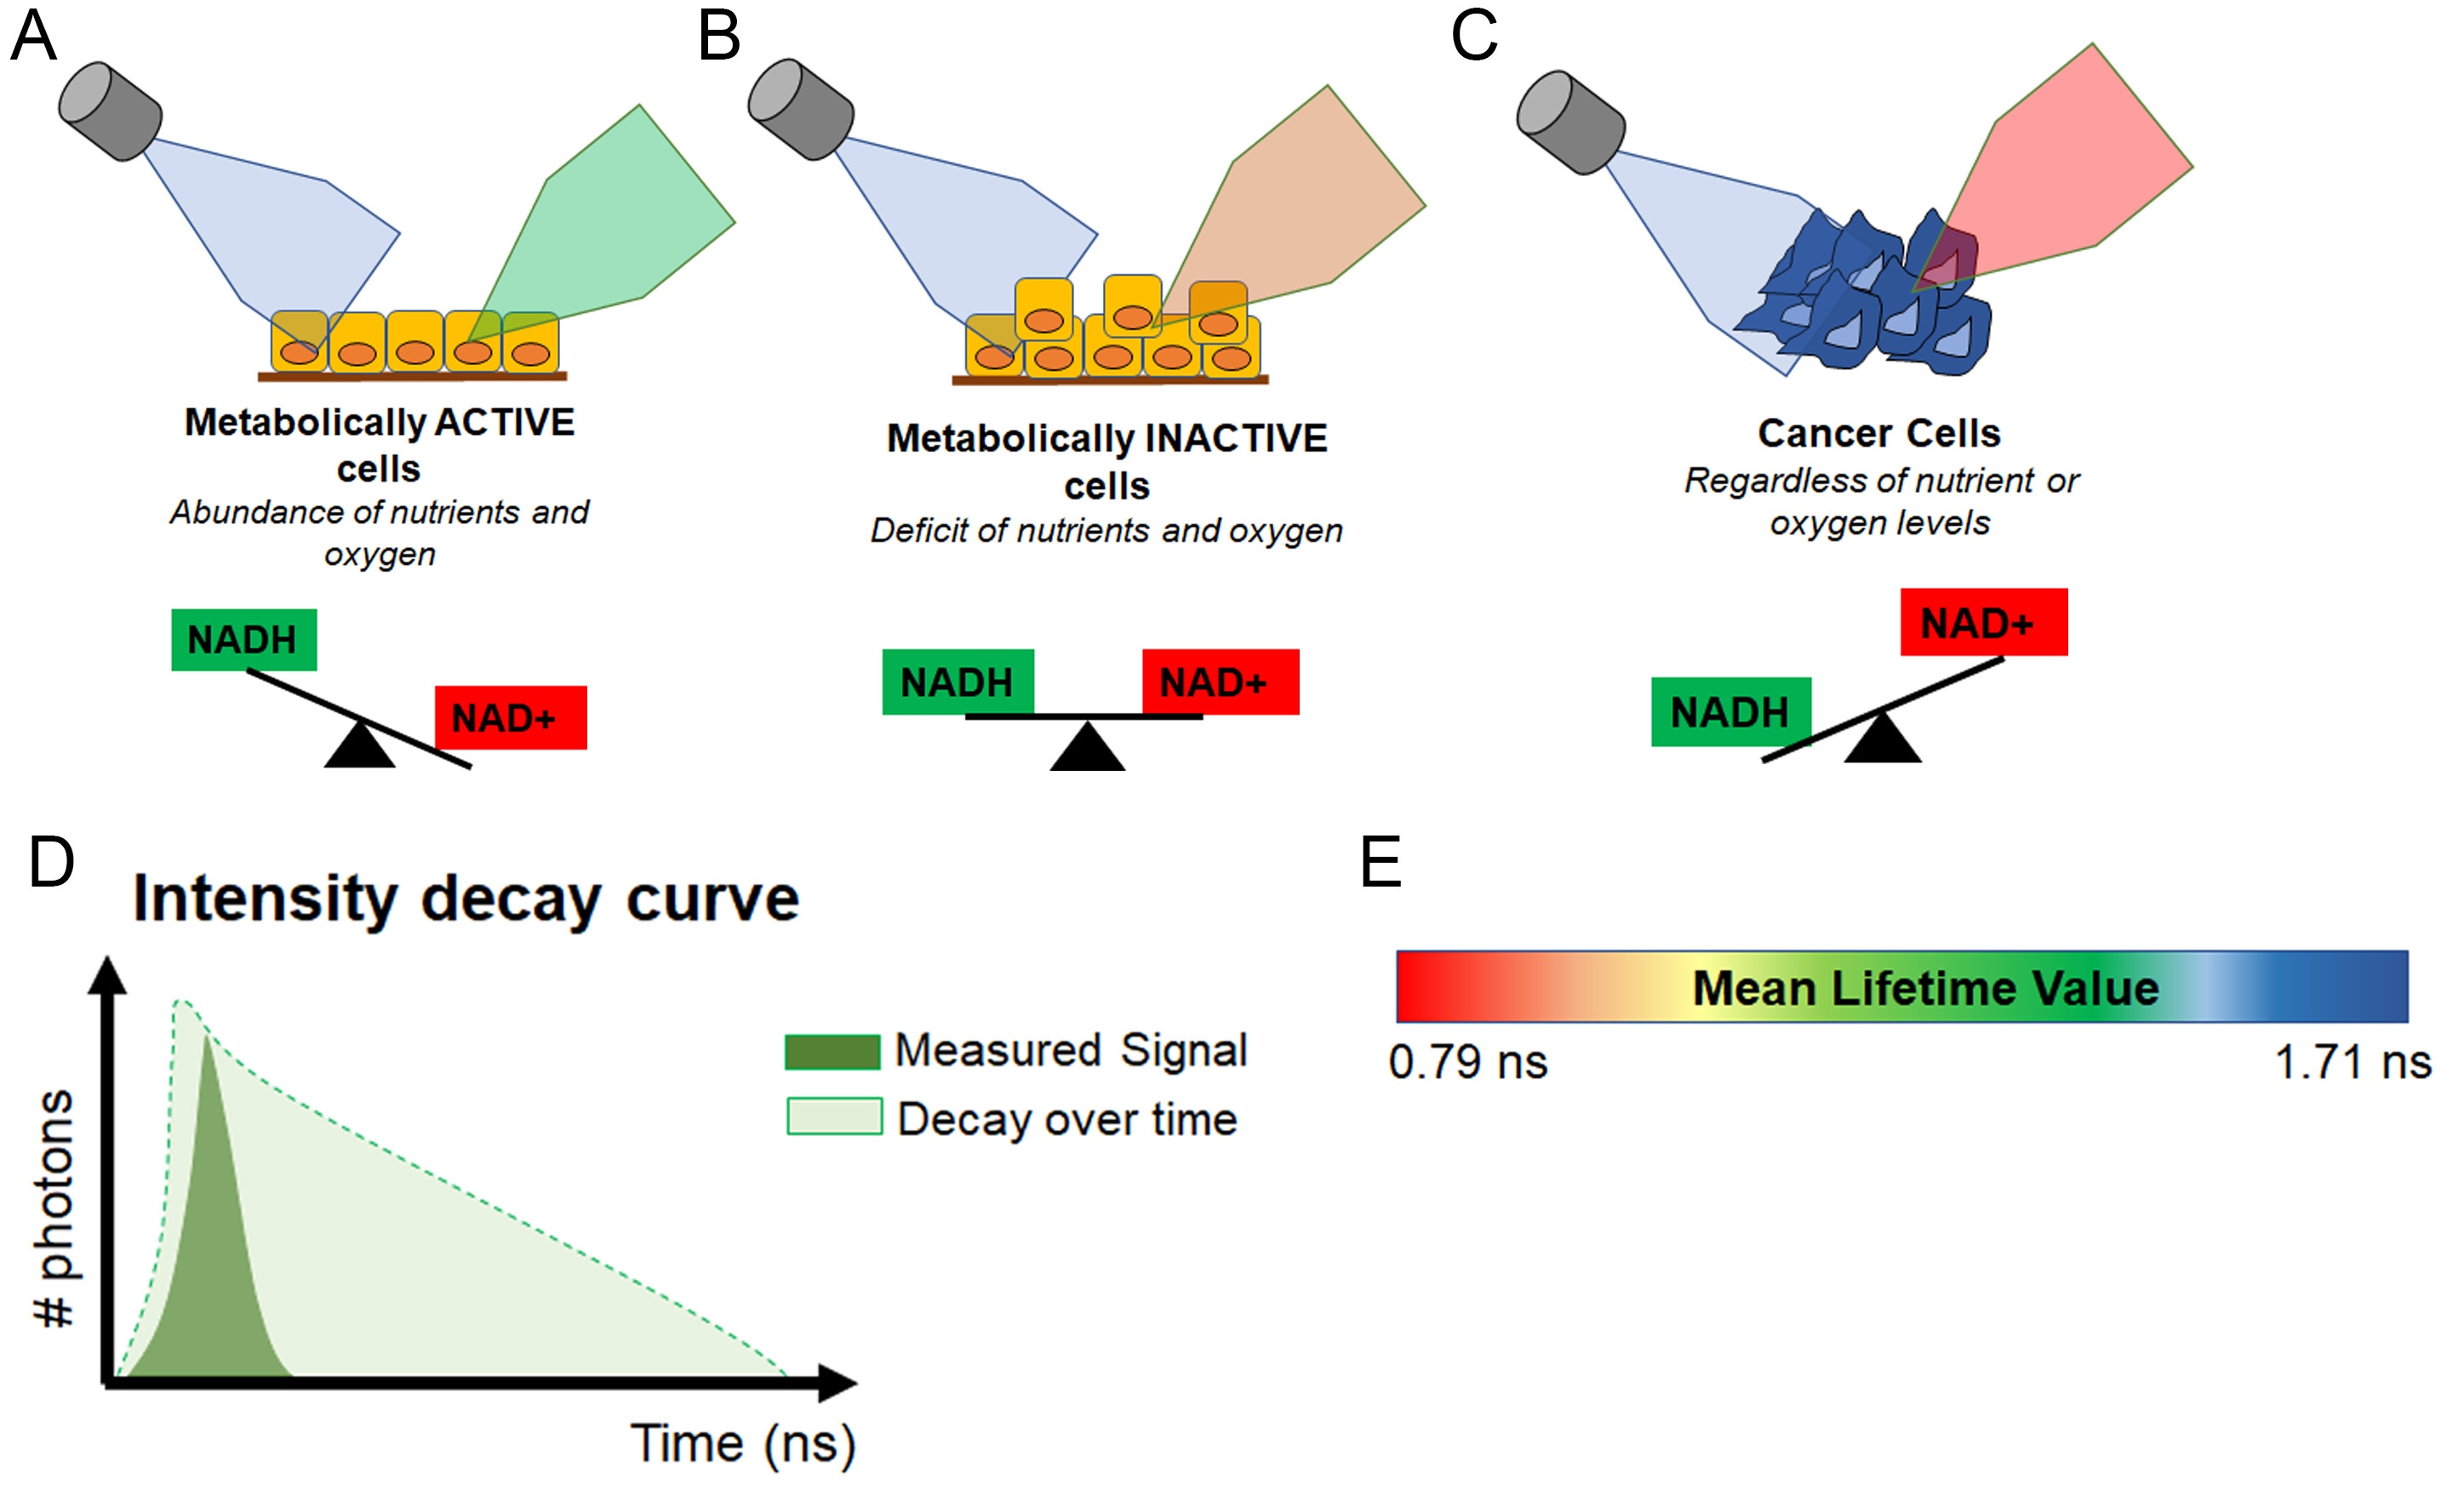
In other words, healthy, metabolically active cells which have high levels of NAD(P)H, will autofluoresce green, while tumor cells, which have high levels of NAD+ will not (Figure 4A-C).
To make the assay a bit more quantifiable, AFI-FLIM takes the fluorescence data and creates a measurement called the mean lifetime value. Simply put, the mean lifetime value of a cell is the length of time it takes for the autofluorescence (green) to decay. In other words, the more NAD(P)H a cell has, the longer it will autofluoresce and the greater its mean lifetime value will be. In contrast, cells that have more NAD+ will experience decay much faster and have a lower mean lifetime value (Figure 4D-E).
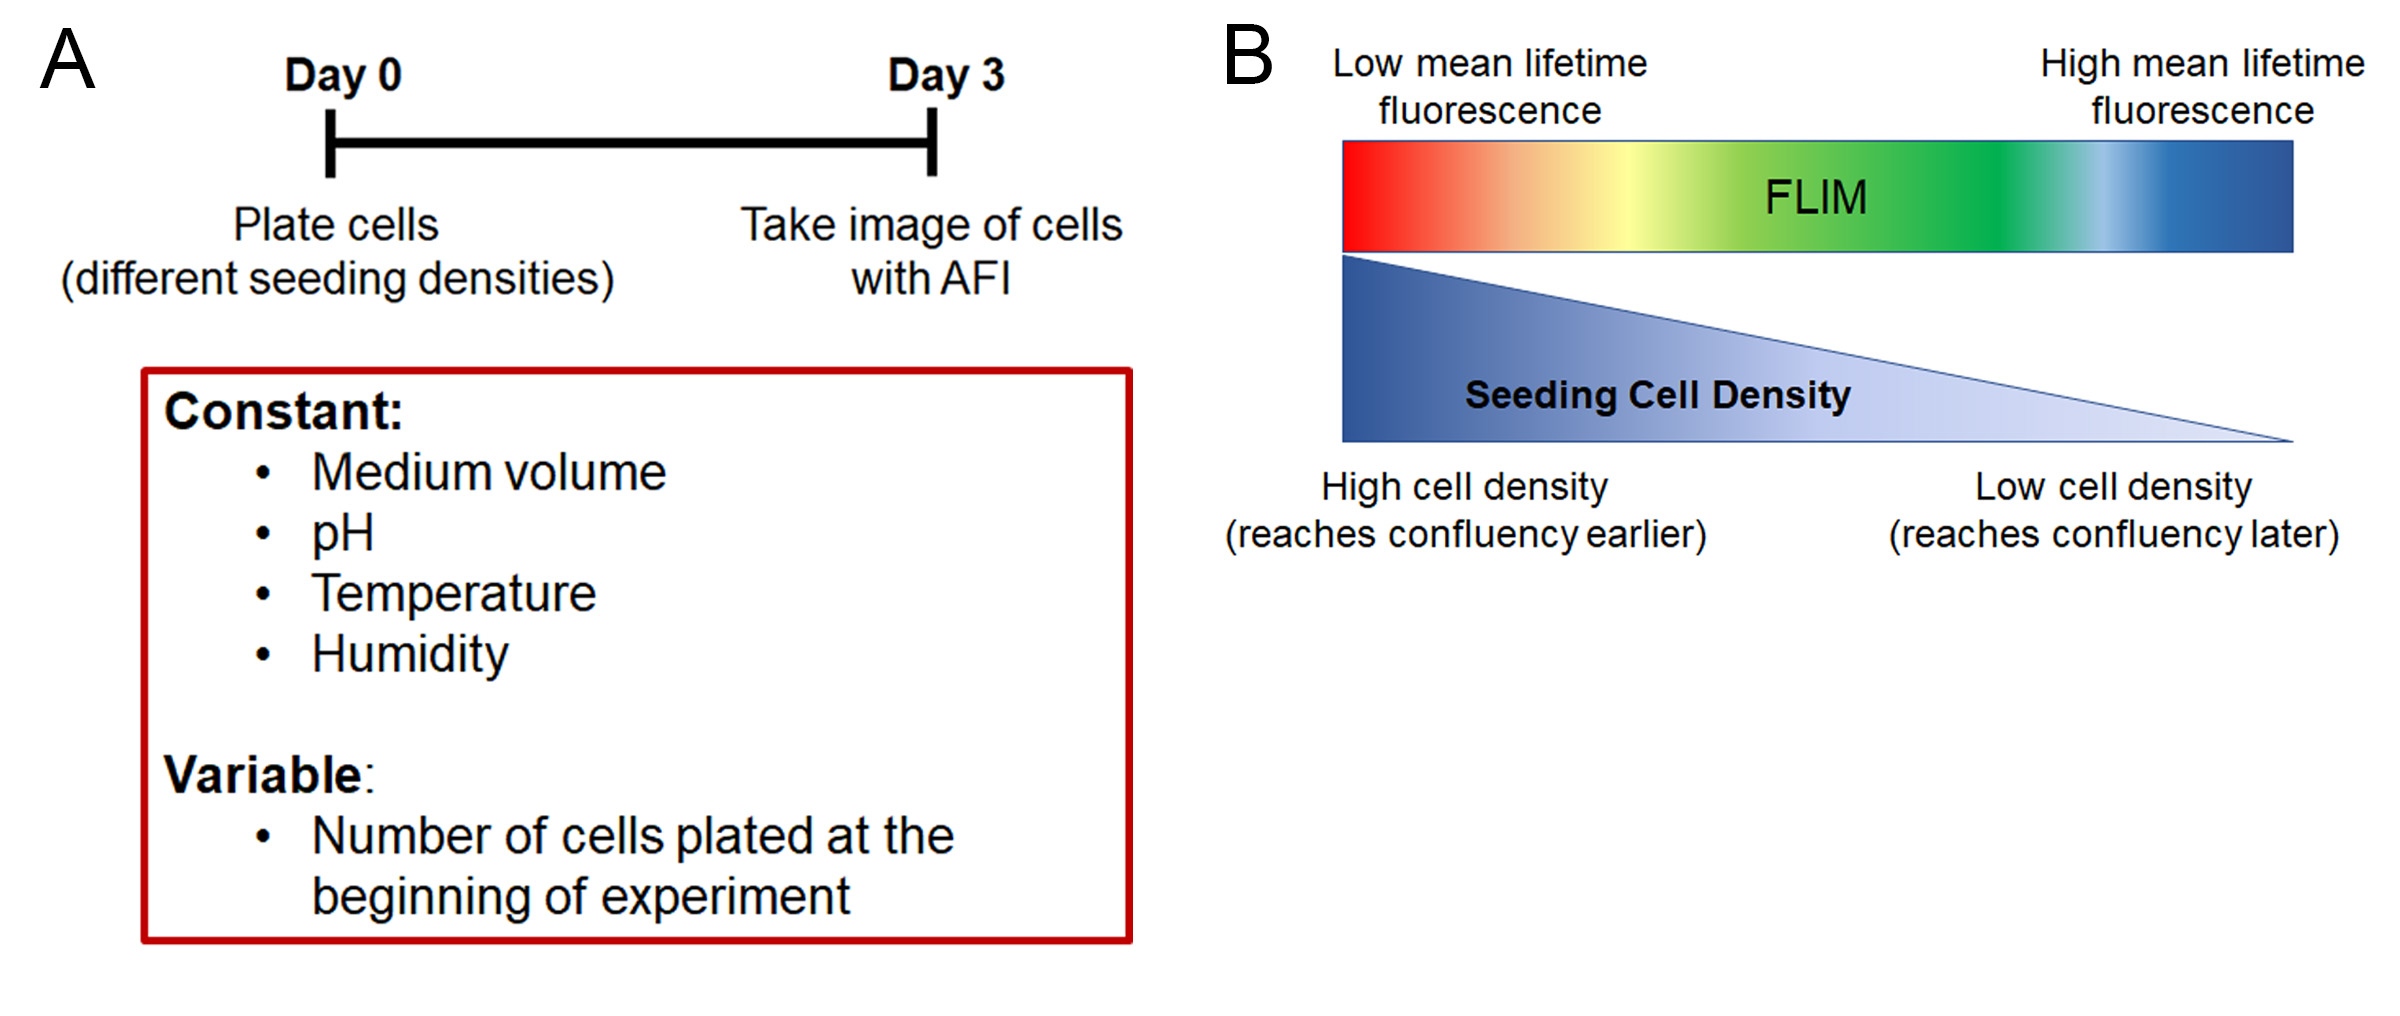
To demonstrate the influence of cell confluency on the mean lifetime value of a monolayer of cells, Chacko and Eliceri plated cells into 12 wells in a logarithmically descending seeding number. They cultured these cells for 3 days without changing any medium to control for the amount of nutrients. They also controlled for the percentage of CO2 in the incubator, as well as the temperature and humidity. After 3 days of culture, they took images of the cells using AFI and calculated the mean lifetime value of the cells in each well (Figure 5A).
Within the same cell line, the mean lifetime value of cells plated at lower density was significantly higher than cells seeded at higher density. In other words, the more confluent the cells were, the less they autofluoresced green. This demonstrated that at higher seeding densities, the cells became metabolically inactive faster (Figure 5B).
This phenomenon was observed across cell types, in both normal and cancer cells. Thus, the researchers concluded that confluency is a key factor when comparing samples using optical assays of lifetime metabolism.
Study 1 is by: Chacko 2019 et al. - Autofluorescence Lifetime Imaging of Cellular Metabolism: Sensitivity Toward Cell Density, pH, Intracellular, and Intercellular Heterogeneity (https://www.ncbi.nlm.nih.gov/pmc/articles/PMC6329636/)
Take home message of Study 1: at higher cell density, cells become metabolically inactive faster. At lower cell density, cells stay metabolically active longer. You must control for confluency when designing experiments that assess cell metabolism over time.
The scenario in which cell density may impact reproducibility: you are testing the metabolic activity of cells before and after treatment with a new compound. For the first experiment, you seed cells at high density, and they reach confluency before the treatment period ends. Your results show that the cells are metabolically inactive after treatment. For the second experiment, you seed cells at lower density, and they don’t reach confluency by the end of the treatment period. Your results show that the cells are metabolically active after treatment. Which result is the correct one?
------------------------
Automated image analysis of time-lapse videos of cell cultures can assist in the optimization of seeding density for cell metabolism assays. To get insight into cell growth in multi-well plates we recommend looking at the CytoSMART Omni.
-------------------------
Study 2: Cell density influences the outcome of drug efficacy studies
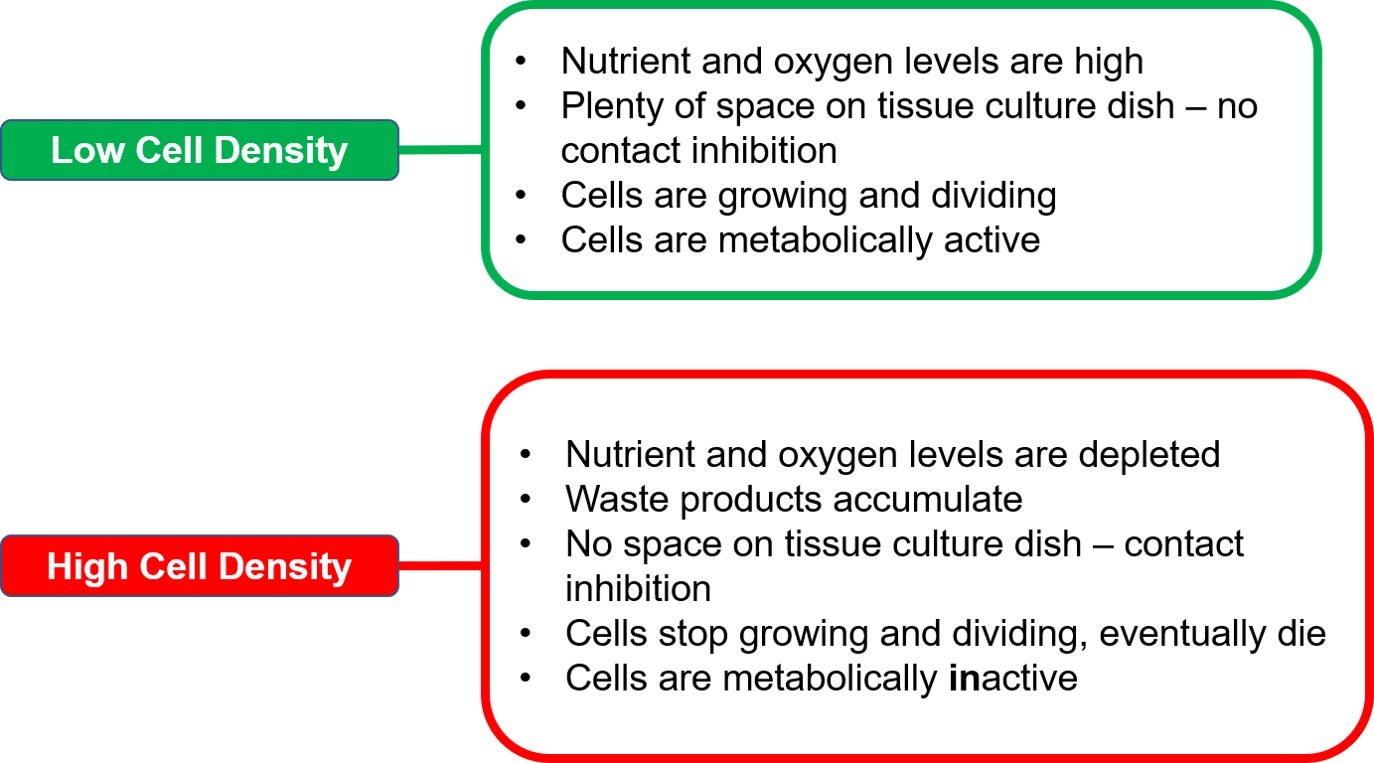
Cells in culture will go through various growth phases during the course of the culture period. The metabolic state of cells varies greatly as cells enter a new growth phase. Cells in the log or exponential phase of growth are metabolically active. They proliferate, absorb nutrients and uptake chemicals that are present in the culture medium. After the log phase, most cell lines will transition into the stationary phase, in which they no longer divide and are metabolically inactive.
Seeding density determines how quickly cells reach the stationary phase. At lower density, cells have ample amounts of nutrients and physical space to grow and divide. Hence, they will stay in the log phase longer. In contrast, at higher density, cells would run out both space and nutrients at a faster rate, and ultimately stop dividing due to contact inhibition, thus, entering the stationary phase (Figure 6).
----------------------
Automated confluency detection can help researchers to keep cells in their active state by preventing contact inhibition. For researchers interested in remote cell culture monitoring we recommend the CytoSMART Lux2.
----------------------
A key step in developing therapeutic agents for cancer is to test drugs in human cancer cell lines. Using mammalian cell culture, the effects of a drug on cell proliferation or survival are investigated over a period of time. These cell viability assays are impacted by the metabolic state of the cells. Considering that cell density affects the metabolic state of cells, drug efficacy assays may also be impacted by cell confluency.
To test this hypothesis, Muelas and colleagues designed a study in which cancer cells were seeded at varying densities then treated with the chemotherapeutic agent, glutaminase-1-enzyme inhibitor (GLS1i). They utilized two types of cells, A549 and H358. A549 was previously reported to be sensitive to the cytotoxic properties of GLS1i, while H358 was reported to be resistant.
In the first experiment, they plated 8 x 10⁵ cells/well and allowed the cells to grow for 24 hours. After 24 hours, the cells reached 100% confluency. At this point, cells were treated with GSLi. Forty-eight (48) hours after the treatment, they assessed cell survival. To their surprise, neither A549 nor H358 cells died in response to treatment (Figure 7).
Then they adjusted the cell culturing conditions to ensure that (1) cells were in their exponential growth phase 24 hours after seeding and (2) confluence was reached as late as possible. With experimentation, they determined that lower seeding densities for both cell lines (2x10⁵ for A549 and 3 x10⁵ for H358) would fulfill those criteria.
When these culturing conditions were utilized, the cells appropriately responded to the drug. A549 cells died in response to GSLi treatment, while H358 cells did not (Figure 7).
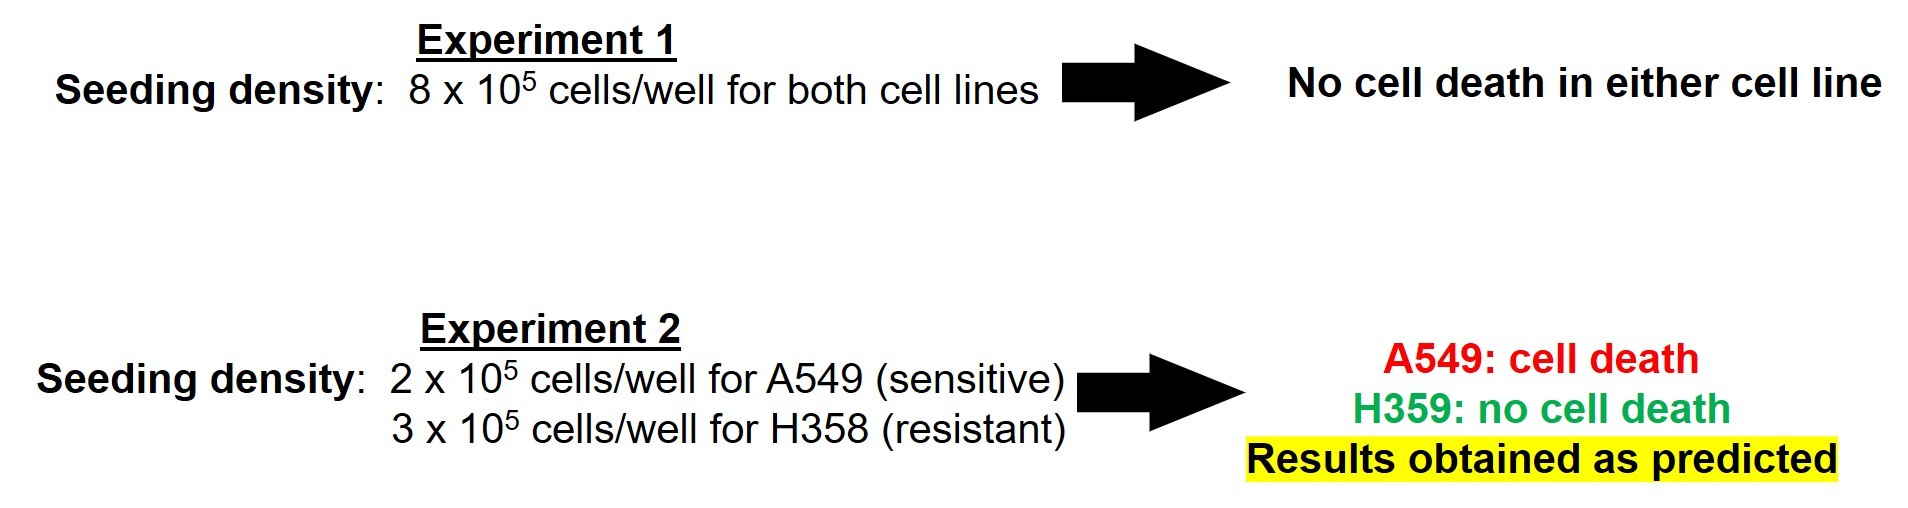
Thus, the investigators concluded that the cytotoxicity of GSLi is dependent on cell confluency.
Study 2 is by: Muelas et al. 2018 - Rational Cell Culture Optimization Enhances Experimental Reproducibility in Cancer Cells (https://www.nature.com/articles/s41598-018-21050-4)
Take home message of Study 2: inappropriate seeding densities can significantly alter the outcome of drug efficacy assays. Also, it is important to choose the appropriate time frame to conduct an experiment so that the growth phase does not shift during the assay, or between experimental replicates.
The scenario in which cell density may impact reproducibility: you are testing the toxicity of a new chemotherapeutic agent. For experiment 1, you treat 1 million cells with the drug. None of the cells die. For experiment 2, you treat 250,000 cells with the same amount of drug, all of the cells die. Which result reveals the cytotoxicity of the drug?
So, where do we go from here?
Irreproducible studies cost an estimated $28.2 billion in the U.S. alone. More than a quarter of those irreproducible findings are a result of poor study design. This means that errors in experimental design cost approximately $7.8 billion (Figure 8). The studies presented above clearly demonstrate that cell confluency can impact the reproducibility of a study, and although cell culture methodologies shouldn’t differ between researchers or research groups, oftentimes they do. Therefore, we need to come up with a solution to ensure that cell culturing conditions are more consistent. Perhaps automating the various steps in the culture process (e.g. counting cells) or in the way we analyze the data (e.g. determining confluency) would reduce variability.
So, what are our options?
Commonly used protocols to evaluate the confluency of adherent cells in vitro are invasive (requires exogenously added fluorophores), destructive (endpoint assays in which cells are lysed or stained with dyes), and do not allow for continued, undisturbed growth of cells within flasks/plates.
Fortunately, recent developments in nondestructive image-based methods have greatly improved our ability to assess cell proliferation. In addition to AFI-FLIM, technology like genetically encoded fluorescent sensors (LINK) allow us to monitor cell growth throughout the course of an experiment. Thus, utilization of these technologies may drastically improve the reproducibility of biomedical studies.
It is time we get ourselves out of this reproducibility crisis.
Related Products
There are currently no products tagged to this resource.